Financial Letter - July 29nd, 2018
182nd Issue (since 01/24/2015)
Market Risk
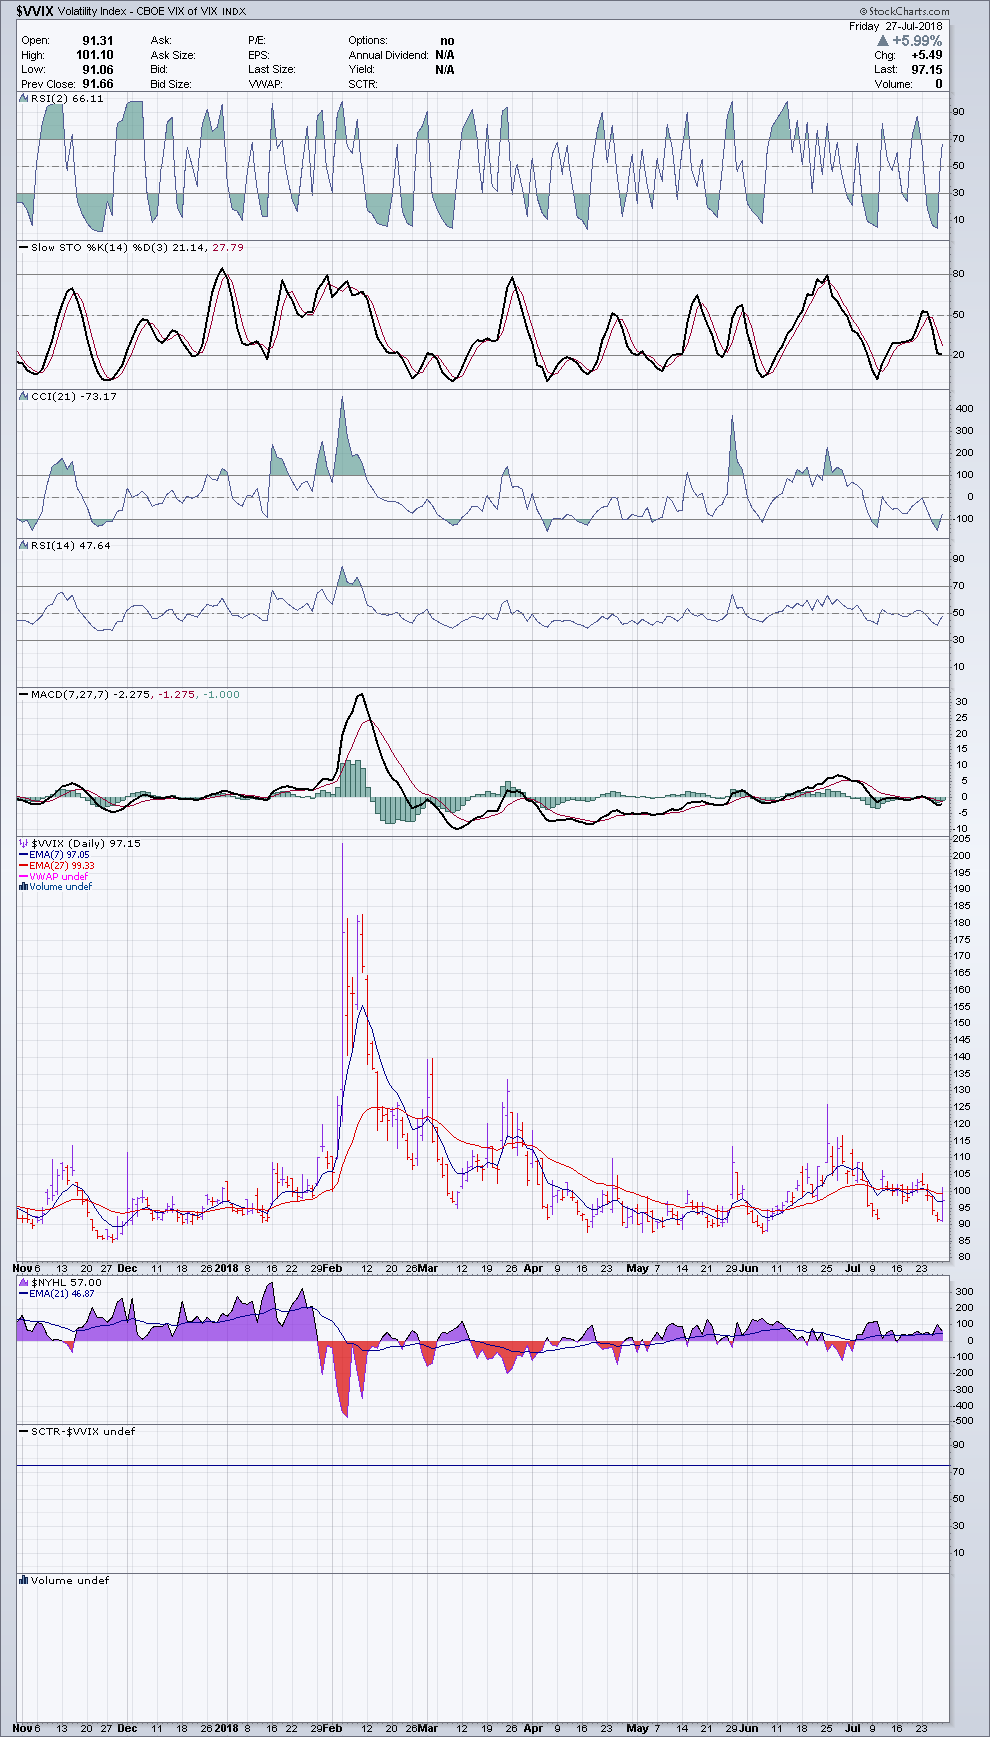
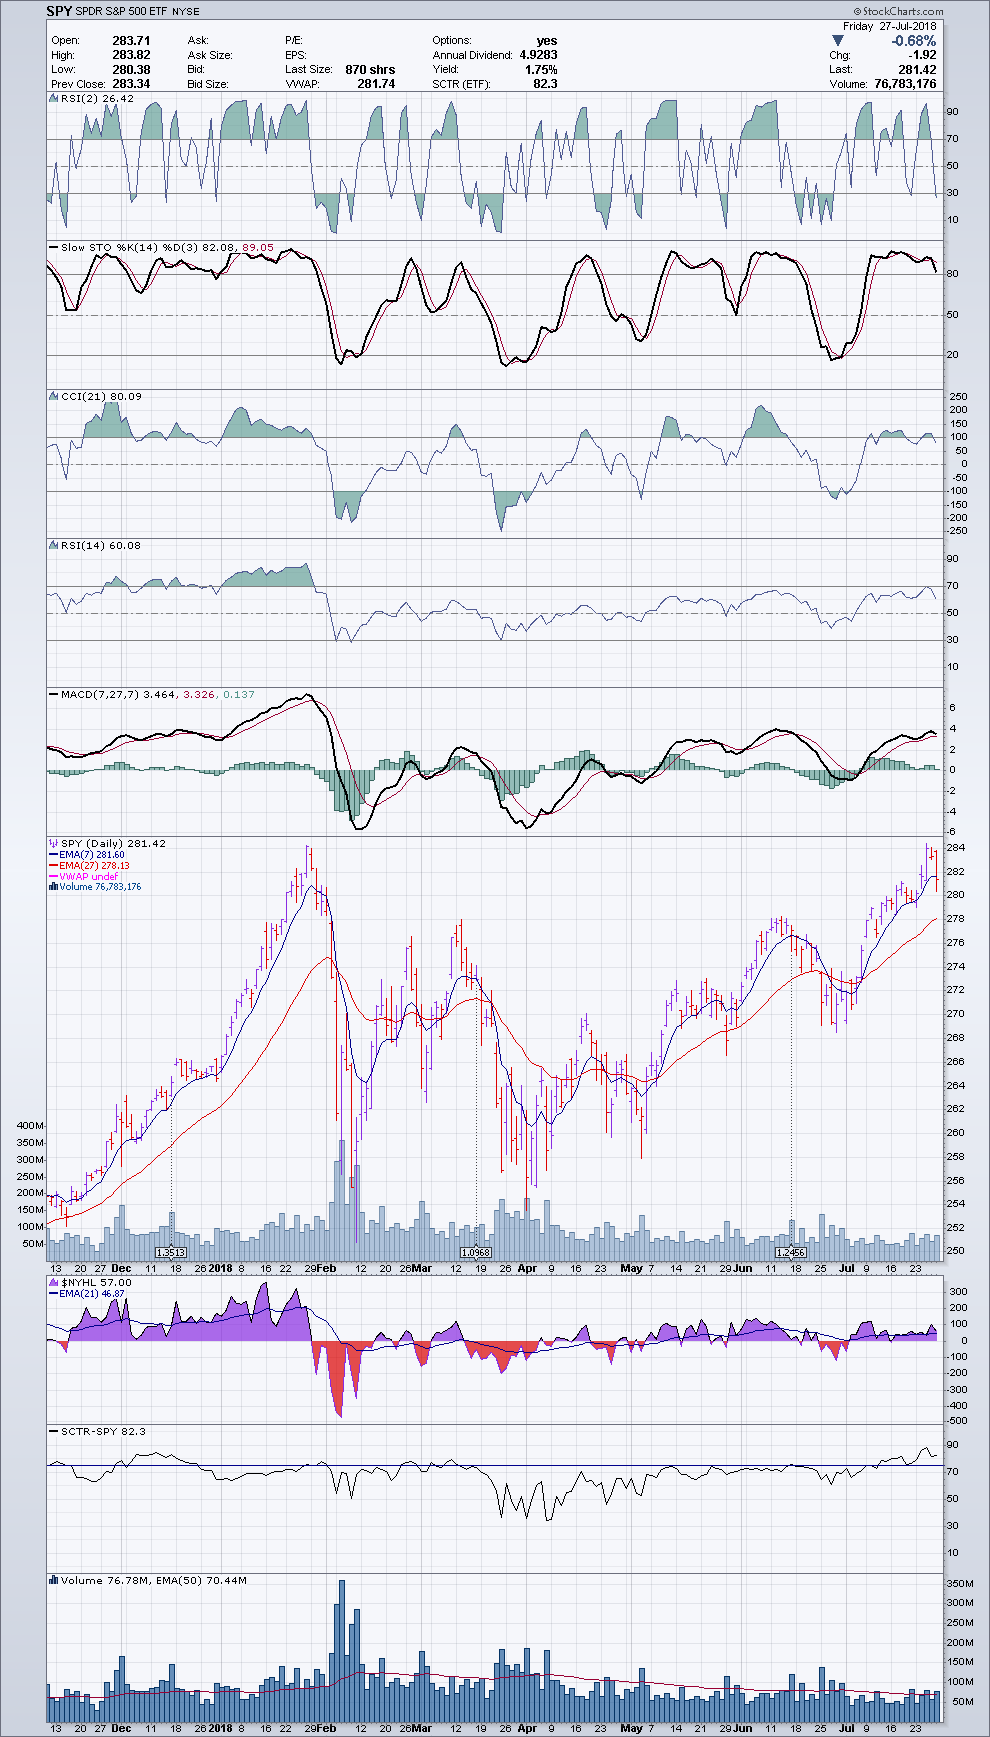
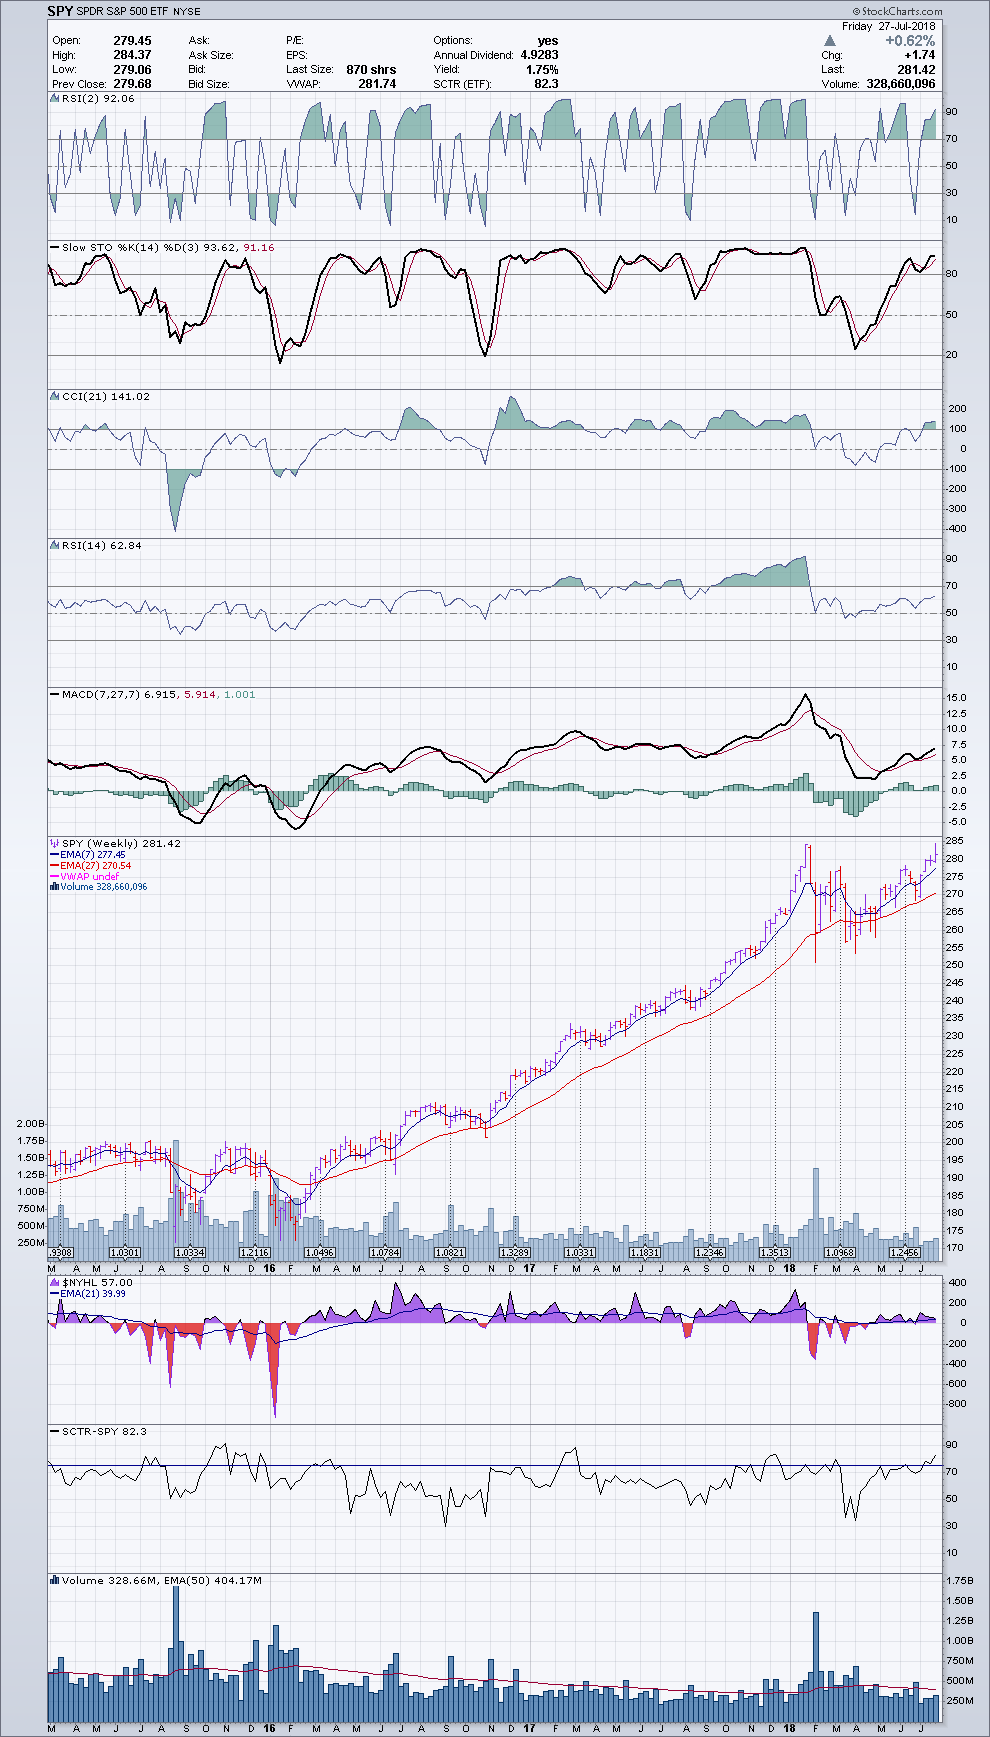
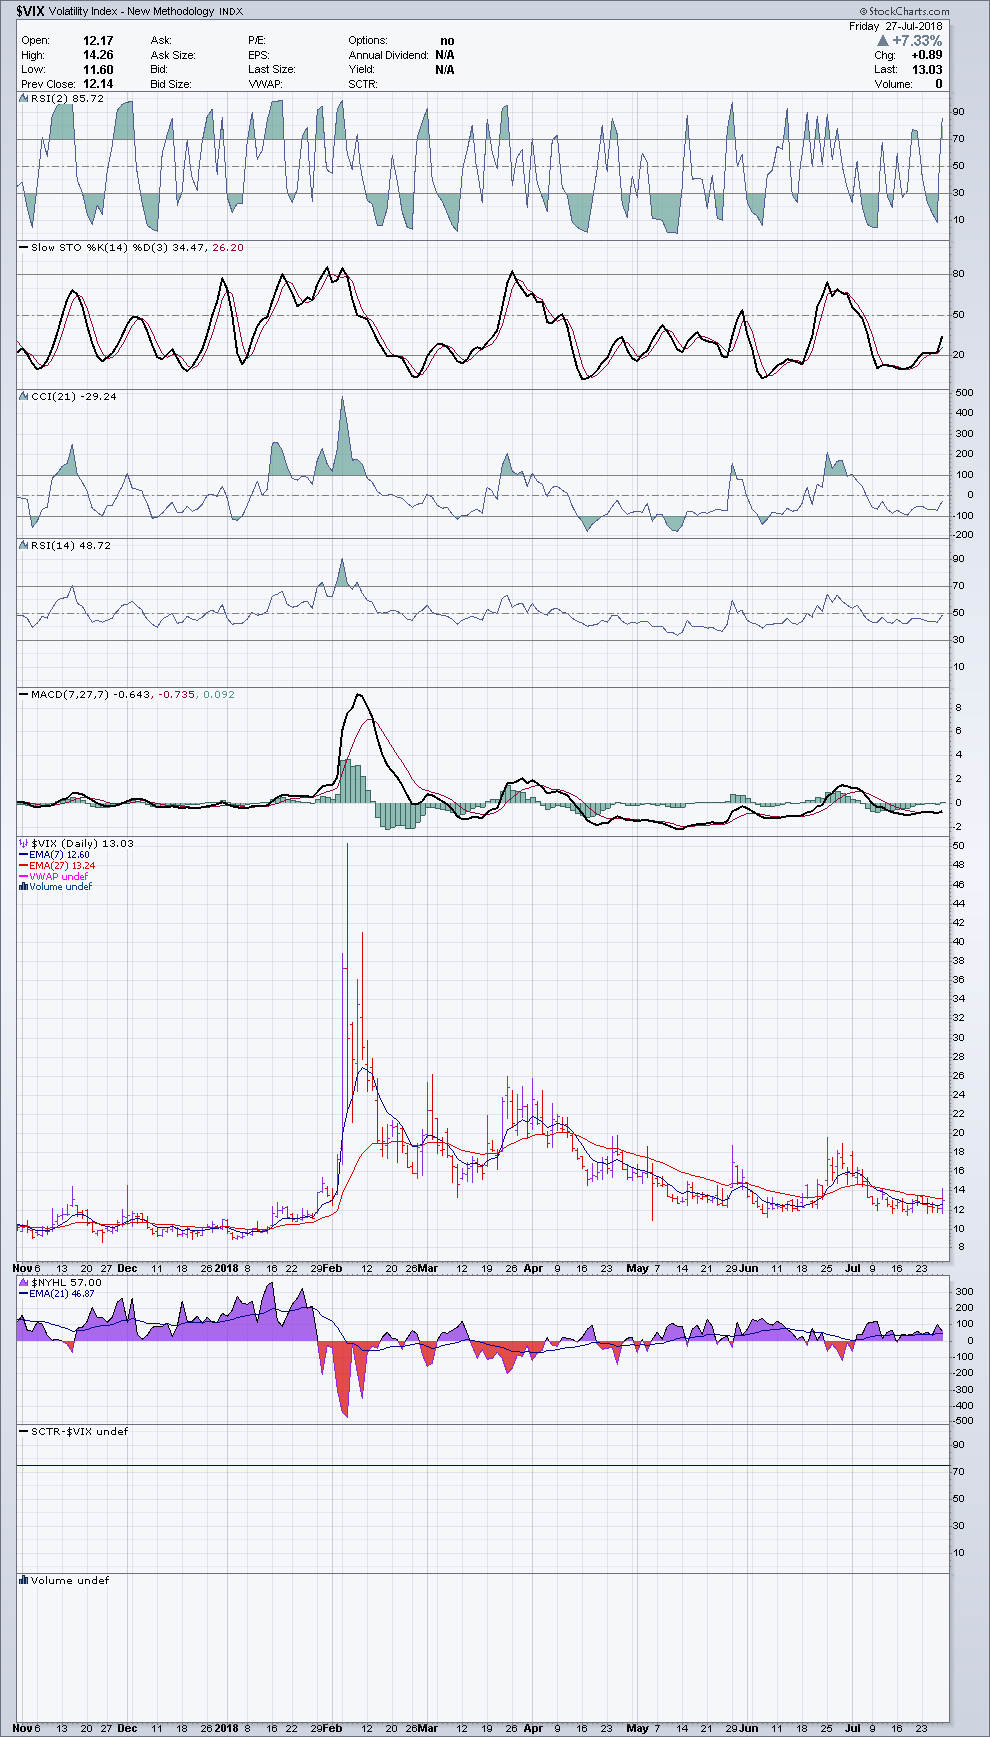
The SPY sailed the thirtieth week of 2018 with tail winds that propelled the price on July 25 at 284.37, practically the same price as on January 26, the historic high.The VIX is comfortably low (when VIX goes down the SPY goes-up and vice versa – see chart n. 3). The volatility of VIX (VVIX – chart 4) show the fluctuations of VIX are at the same level than during the bull market of 2017 and January 2018: a positive sign. The long-term chart is showing more comfortable bullishness (see chart 2 - SPY - weekly). SPY attained a new historical high at 285.49 points on January 26, 2018.
The conclusion about this past week: the blue sky seems persistent.
The Langford Management
Presently our investments are in ETFs and ETN offering a high return, with a dividend yield between 5 to 10 % per year, at pro rata temporis, monthly. The market has still a strong positive bias. We don’t think for the moment to change the allocation because also the products with higher returns are also bullish.
In the USD accounts, still we have cash, in the form of FLOT, MINT, NEAR. In the CAD accounts, it is PSA or the equivalents. In the average, our portfolios are invested 60% in revenue and 40% in directivity.
In some, more aggressive accounts we have increased the capital synthetically with option strategies to profit of the actual upward strong momentum. In accounts that allow futures markets, we have futures contracts in long position on stock indexes.
Our portfolio management is always ad hoc, for each client. But also, we offer now five standardized mini-portfolios for clients interested:
Bullish aggressive
A contrarian as a hedge or profit
Bullish and dividend oriented
Against inflation
Bullish, aggressive on non-traditional assets.
(The portfolio management fees of Charles K. Langford Inc. is 0.9% of assets, per year (equivalent to $900 per $100,000). The capital under management is invested exclusively in ETF, ETN and options)
Among a group of selected stocks and ETFs, the week just ended has given middle- and long-term buy signals for the following stocks and ETFs.
TREND FOLLOWING
|
Middle-term bullish |
Long-term bullish |
|
|
Canadian Market |
Symbol |
MEK.V |
Options Strategies
Investors that believe the current Canadian market offers interesting bullish opportunities, they can buy the call on BCE (it closed Friday at $55.03) August 24/52.50 @ $2.71 whose delta is 0.91 and gamma 0.08 (accelerator of delta). This call will offer a profit of 91% of the stock increase at a cost that is about 20 times lower than the present price. If the stock goes down, the maximum loss is the premium.
SPY - Daily - 2018/07/27
SPY - Weekly - 2018/07/27
VIX - Daily - 2018/07/27
VVIX - Daily - 2018/07/27