Financial Letter - June 23rd, 2019
229th Issue (since 01/24/2015)
CKL Inc. offers presently to his customers a portfolio based essentially on performance (0.9/10): the 0.9 indicates the annual administrative % cost of management; the 10 represents the 10% of management fees on the gains above the high-water mark. The portfolio is made by only one ETF US plus options strategies of the US market. This style of portfolio requires a capital of 250,000US$ or equivalent in CAD and the level 4 in options negotiation.
It is now available on Kindle and on other electronic reading platforms in French a short manual on the Day Trading. The title is: « Le ‘Day Trading’ ou La négociation sur séance (1) », written by Charles K. Langford and Audrey Parent Thibeault.
It is now available on Kindle and on similar electronic reading platforms in French a short manual on the put/call ratio. The title is: « L’antagonisme entre les options put et call: l’analyse du put/call ratio », written by Charles K. Langford and Laurence P. Darveau.
The book “L’alchimie qui crée l’or – Le chasseur de tendances boursières II” is online (Amazon.ca and the title) on Kindle. It is in French. The book is now a “bestseller” in the category business and finance. It's also available on all other readers platforms (Kobo, iBook, etc.).
A second book is available on the reading software like Kindle, Kobo, iBook, etc. Its title is “The Trend Hunter” and it is in English.
The website of Charles K. Langford Inc. is : www.charlesklangford.com
Market Risk (Systematic Risk)
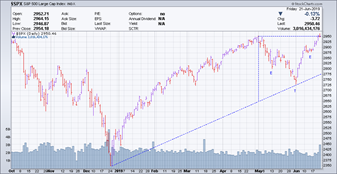
The market (S&P500 Index with its FNB SPY and its derivatives) ended the week with a gain of 2.2% at 2950.46 points compared to the previous Friday at 2886.98 points. This is the third week of bullishness. On Friday, during the session, the index made an historical high at 2964.50 points. At the close on Friday the index was up 7.2% in June, cancelling the loss of 6.6% of May and it is up 18% since the beginning of 2019. The weekly gain was due by the contribution of a large majority of sectors, especially Energy (+5.2%) and Technology (3.3%).
We believe the market is bullish and we keep our long positions. Next week we will probably add options strategies at zero cost, equivalent to adding, synthetically, some capital to the asset of qualified accounts to improve the return.
In the following weekly chart of the S&P500 Index we see a triangle rectangle; whose shape usually means the market will break the configuration on the upside.
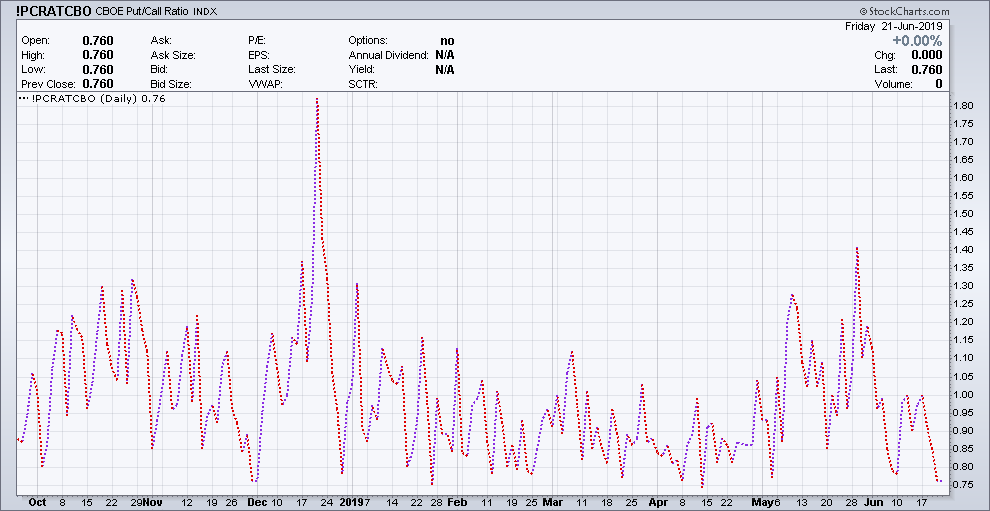
The indicator CKL21 – see chart 4) shows the market (SPY) is strongly bullish: this usually means the market is due for an incumbent temporary short-term correction. For more information about this indicator read the short text “Put/Call ratio” (see above).
The Langford Management
Presently our investments are in ETFs and ETN offering a high return, with a dividend yield between 5 to 10 % per year, at pro rata temporis, monthly. The market has still a strong positive bias. We don’t think for the moment to change the allocation because also the products with higher returns are also bullish.
In the USD accounts, still we have cash, in the form of FLOT, MINT, NEAR. In the CAD accounts, it is PSA or the equivalents. In the average, our portfolios are invested 60% in revenue and 40% in directivity.
In some, more aggressive accounts we have increased the capital synthetically with option strategies to profit of the actual upward strong momentum. In accounts that allow futures markets, we have futures contracts in long position on stock indexes.
Our portfolio management is always ad hoc, for each client. But also, we offer now five standardized mini-portfolios for clients interested:
- Bullish aggressive
- A contrarian as a hedge or profit
- Bullish and dividend oriented
- Against inflation
- Bullish, aggressive on non-traditional assets.
(The portfolio management fees of Charles K. Langford Inc. is 0.9% of assets, per year (equivalent to $900 per $100,000). The capital under management is invested exclusively in ETF, ETN and options)
Among a group of selected stocks and ETFs, the week just ended has given middle- and long-term buy signals for the following stocks and ETFs.
TREND FOLLOWING
|
Middle-term bullish |
Long-term bullish |
|
|
Canadian Market |
TLT.V |
CKK.V |
About Options
Investors that believe the current Canadian market offers interesting bullish opportunities, they can buy the call SNC (stock closed Friday at $27.00) Aug 16/25.00 @ $3.05 whose delta is 0.71 and gamma 0.04 (accelerator of delta). This call will offer a profit of 71% of the stock increase at a cost that is about nine times lower than the present price. If the stock goes down, the maximum loss is the premium.
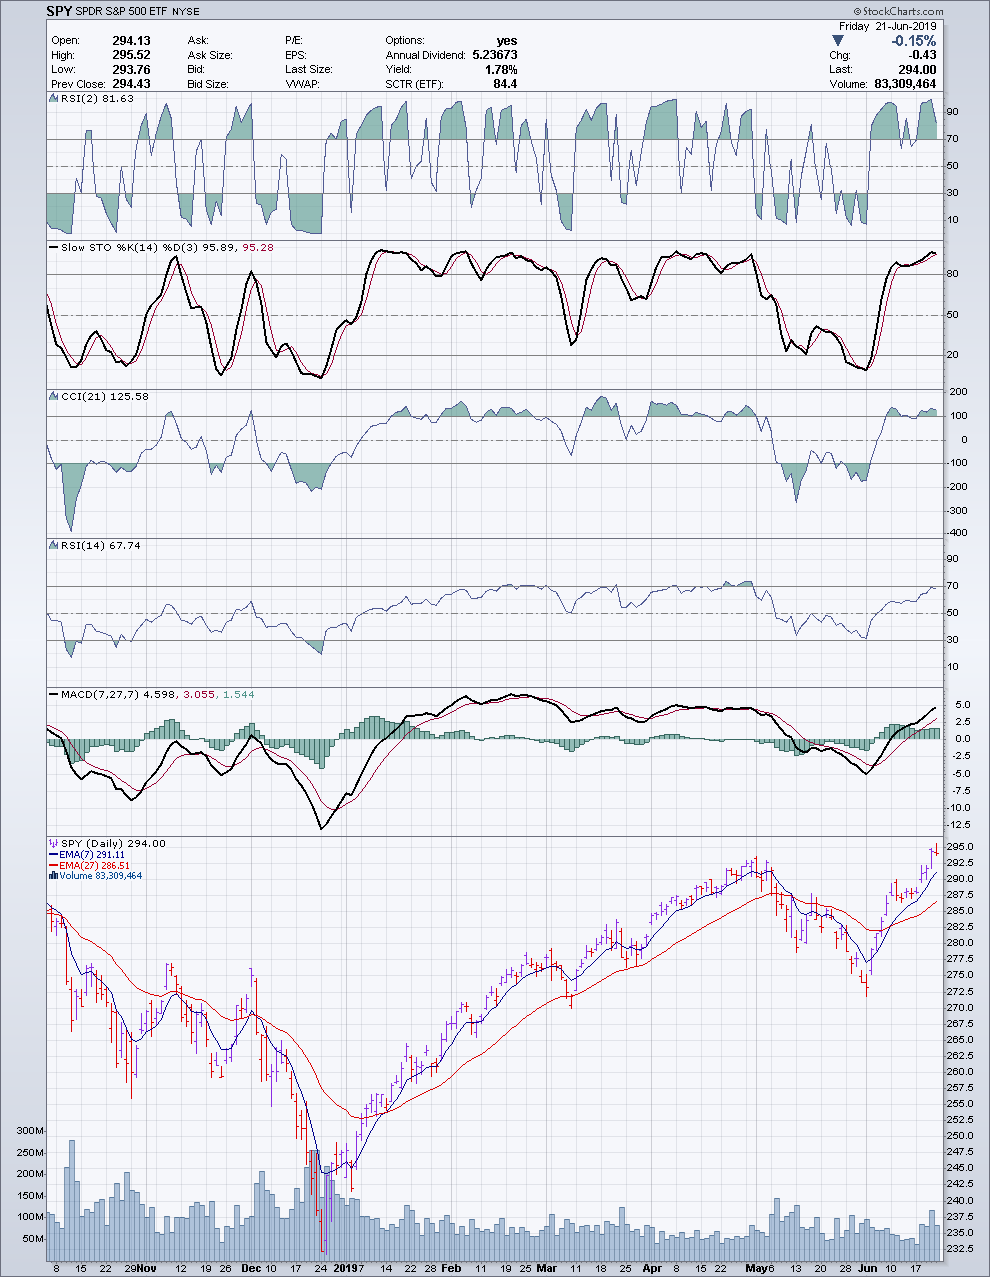
SPY - Daily - 2019/06/21
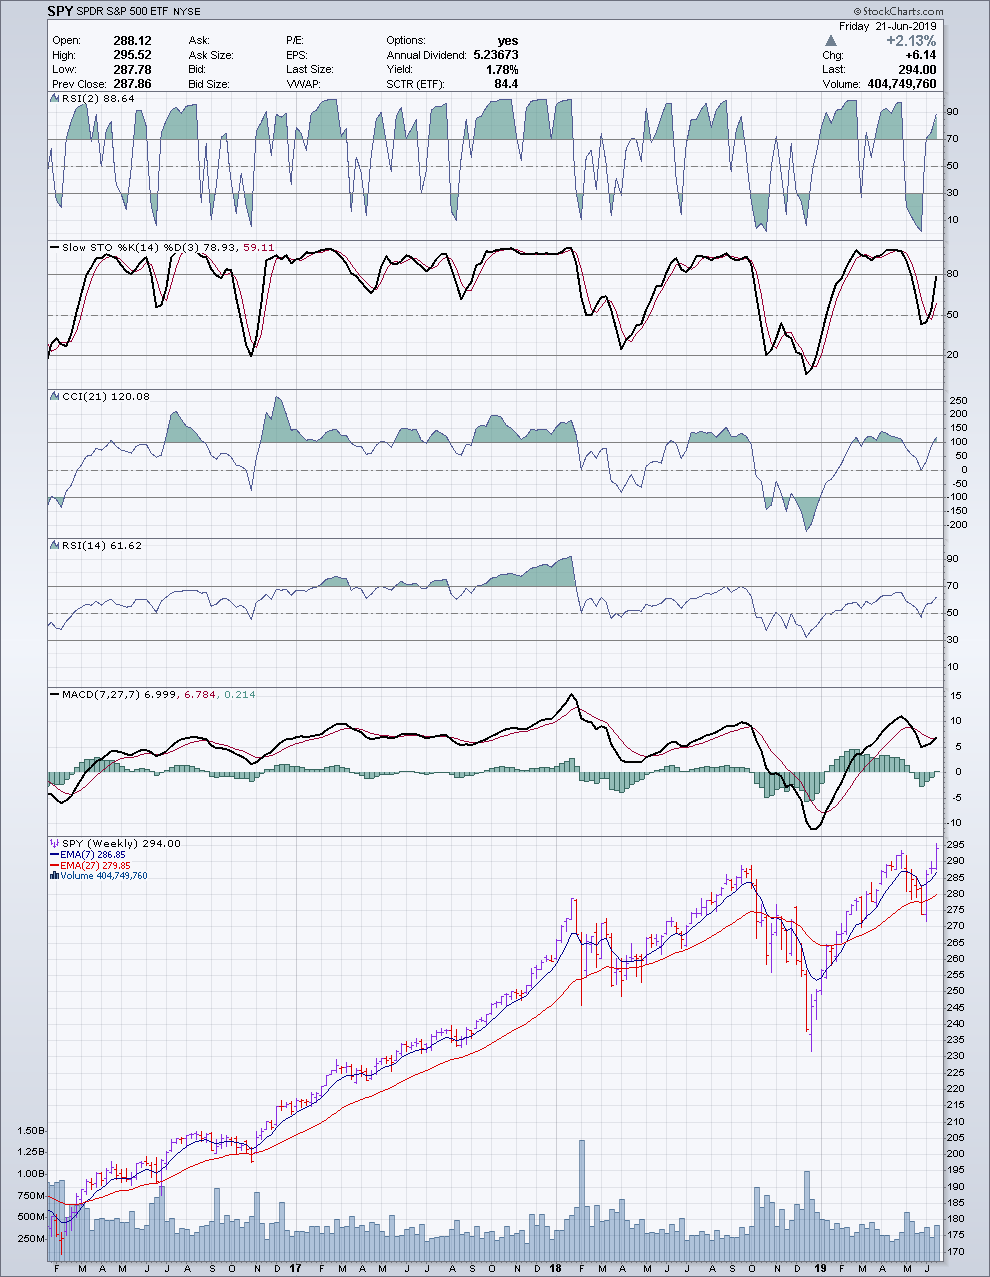
SPY - Weekly - 2019/06/21
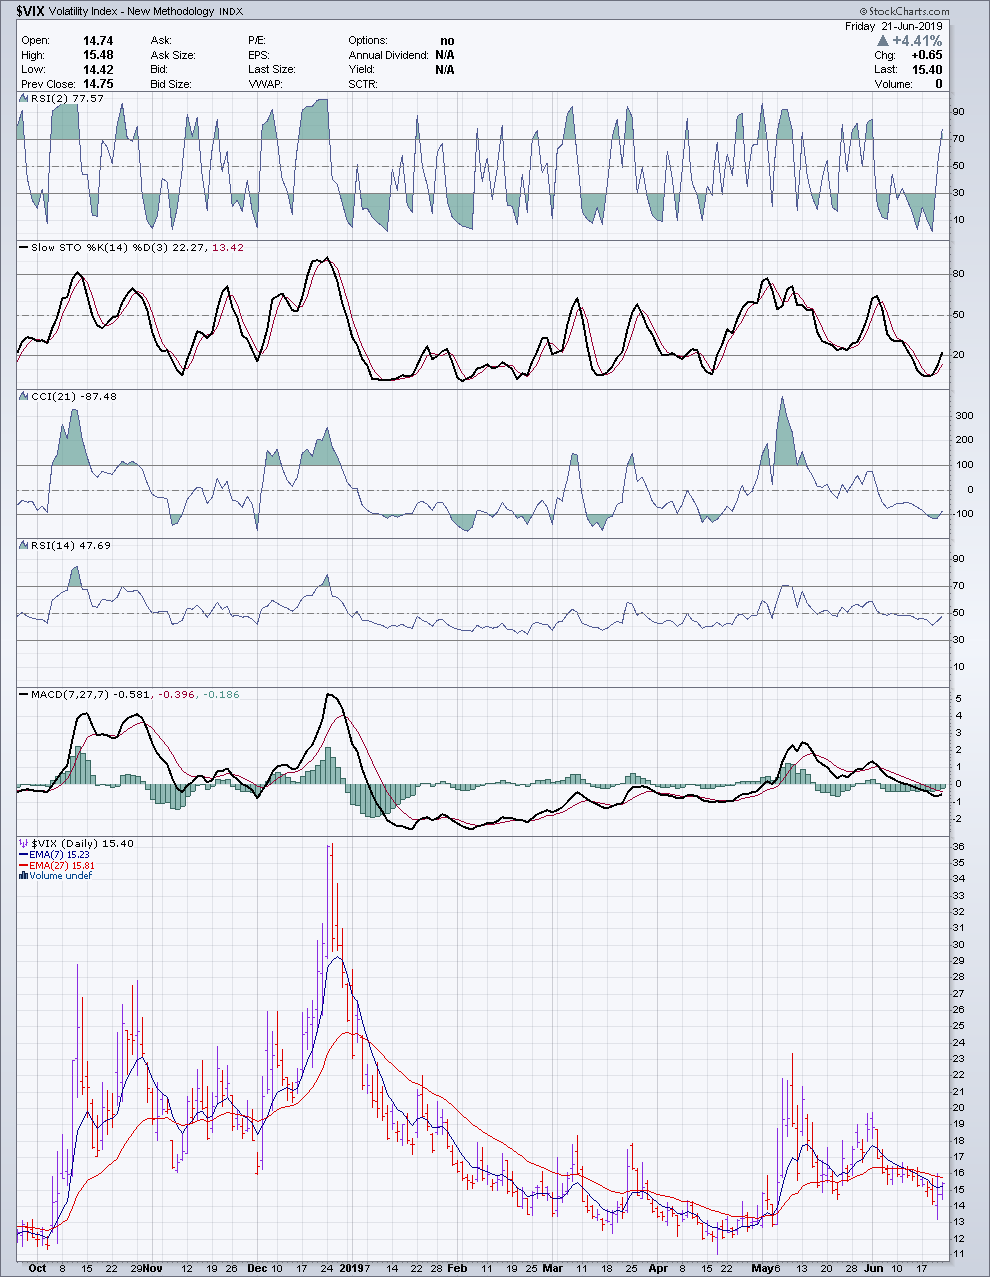
VIX - Daily - 2019/06/21
Put/Call Ratio - 2019/06/21