Financial Letter - March 24th, 2019
216th Issue (since 01/24/2015)
CKL Inc. is now offering a portfolio to its customers based essentially on performance (0.9/10) made of only one US ETF plus options strategies on US ETFs. The 0.9 represents the annual administrative cost of management in percentage and the 10 indicates the percent of management fees above the high water mark. This kind of portfolio requires a capital of 250,000US$ and level 4 in option trading.
The short book on the Put/Call ratio is now available on Kindle and other electronic reading platforms . The title is: « L’antagonisme entre les options put et call: l’analyse du put/call ratio ». The authors of this short book are Charles K. Langford and Laurence P. Darveau.
The book “L’alchimie qui crée l’or – Le chasseur de tendances boursières II” is online (Amazon.ca and the title) on Kindle. It is in French. The book is now a “bestseller” in the category of business and finance. It's also available on all other electronic reading platforms (Kobo, iBook, etc.).
A second book is also available on electronic reading platforms like Kindle, Kobo, iBook, etc. Its title is “The Trend Hunter” and it is in English.
In 2016, the average return of portfolios managed by Charles K. Langford Inc. was 10.90% with a standard deviation of 3.75, after trading commissions and ¾ of management fees.
In 2017, the average return of portfolios managed by Charles K. Langford Inc. was 13.50% with a standard deviation of 4.65%, after trading commissions and ¾ of management fees. The larger standard deviation is explained by options strategies that gave higher returns.
Visit our website at www.charlesklangford.com
Market Risk (Systematic Risk)
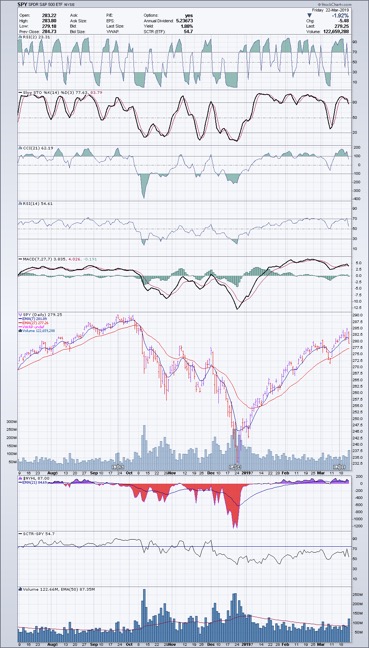
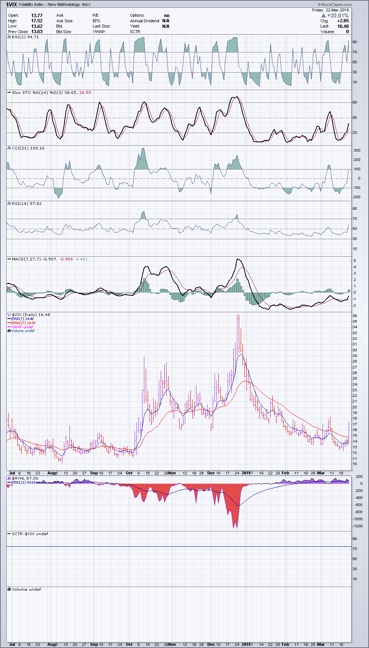
The SPY sailed the twelfth week of 2019 with strong tailwinds and headwinds that ended Friday with a loss of slightly less than 1%. On the previous Friday, the SPY went higher, for the first time, than the long resistance on October 17, November 7 and December 3. This Thursday the SPY made a new high and Friday, as usually happens in these circumstances, the market made a pullback. This doesn’t imply the beginning of a downtrend: it is just a normal behavior of prices. The VIX (see charts 3) is at 16%, a level positive but still not the best for trading comfortably. The best is a VIX at about 10%. We start to enter in the market progressively, as the market keeps its positive bias.
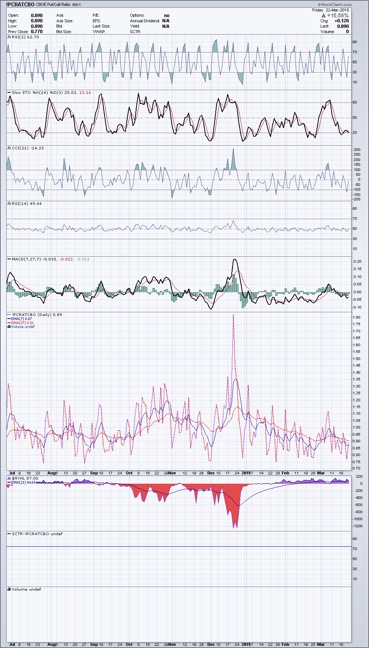
The indicator CKL21 – see chart 4) shows the market (SPY) is now quite neutral with a slight sympathy towards the upside. For more information about this indicator read the short text “Put/Call ratio” (see above).
The Langford Management
Presently our investments are in ETFs and ETN offering a high return, with a dividend yield between 5 to 10 % per year, at pro rata temporis, monthly. The market has still a strong positive bias. We don’t think for the moment to change the allocation because also the products with higher returns are also bullish.
In the USD accounts, still we have cash, in the form of FLOT, MINT, NEAR. In the CAD accounts, it is PSA or the equivalents. In the average, our portfolios are invested 60% in revenue and 40% in directivity.
In some, more aggressive accounts we have increased the capital synthetically with option strategies to profit of the actual upward strong momentum. In accounts that allow futures markets, we have futures contracts in long position on stock indexes.
Our portfolio management is always ad hoc, for each client. But also, we offer now five standardized mini-portfolios for clients interested:
- Bullish aggressive
- A contrarian as a hedge or profit
- Bullish and dividend oriented
- Against inflation
- Bullish, aggressive on non-traditional assets.
(The portfolio management fees of Charles K. Langford Inc. is 0.9% of assets, per year (equivalent to $900 per $100,000). The capital under management is invested exclusively in ETF, ETN and options)
Among a group of selected stocks and ETFs, the week just ended has given middle- and long-term buy signals for the following stocks and ETFs.
TREND FOLLOWING
|
Middle-term bullish |
Long-term bullish |
|
|
Canadian Market |
AXV.V |
BTT.V |
About Options
Investors that believe the current Canadian market offers interesting bullish opportunities, they can buy the call DGC (stock closed Friday at $13.19) April 18/12.00 @ $1.38 whose delta is 0.82 and gamma 0.18 (accelerator of delta). This call will offer a profit of 82% of the stock increase at a cost that is about 10 times lower than the present price. If the stock goes down, the maximum loss is the premium.
SPY - Daily - 2019/03/22
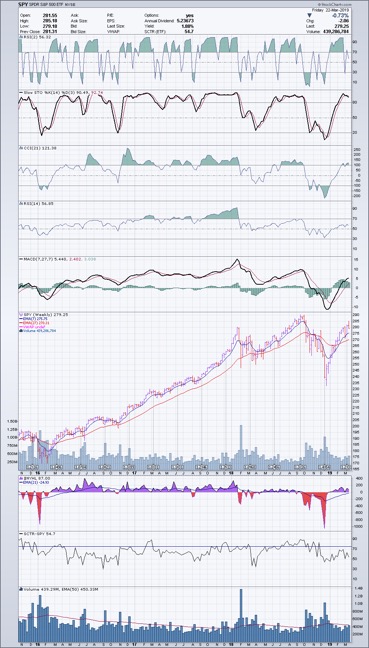
SPY - Weekly - 2019/03/22
VIX - Daily - 2019/03/22
Put/Call Ratio 2019/03/22