Financial Letter - May 6th, 2018
170th Issue (since 01/24/2015)
Market Risk (Systematic Risk)
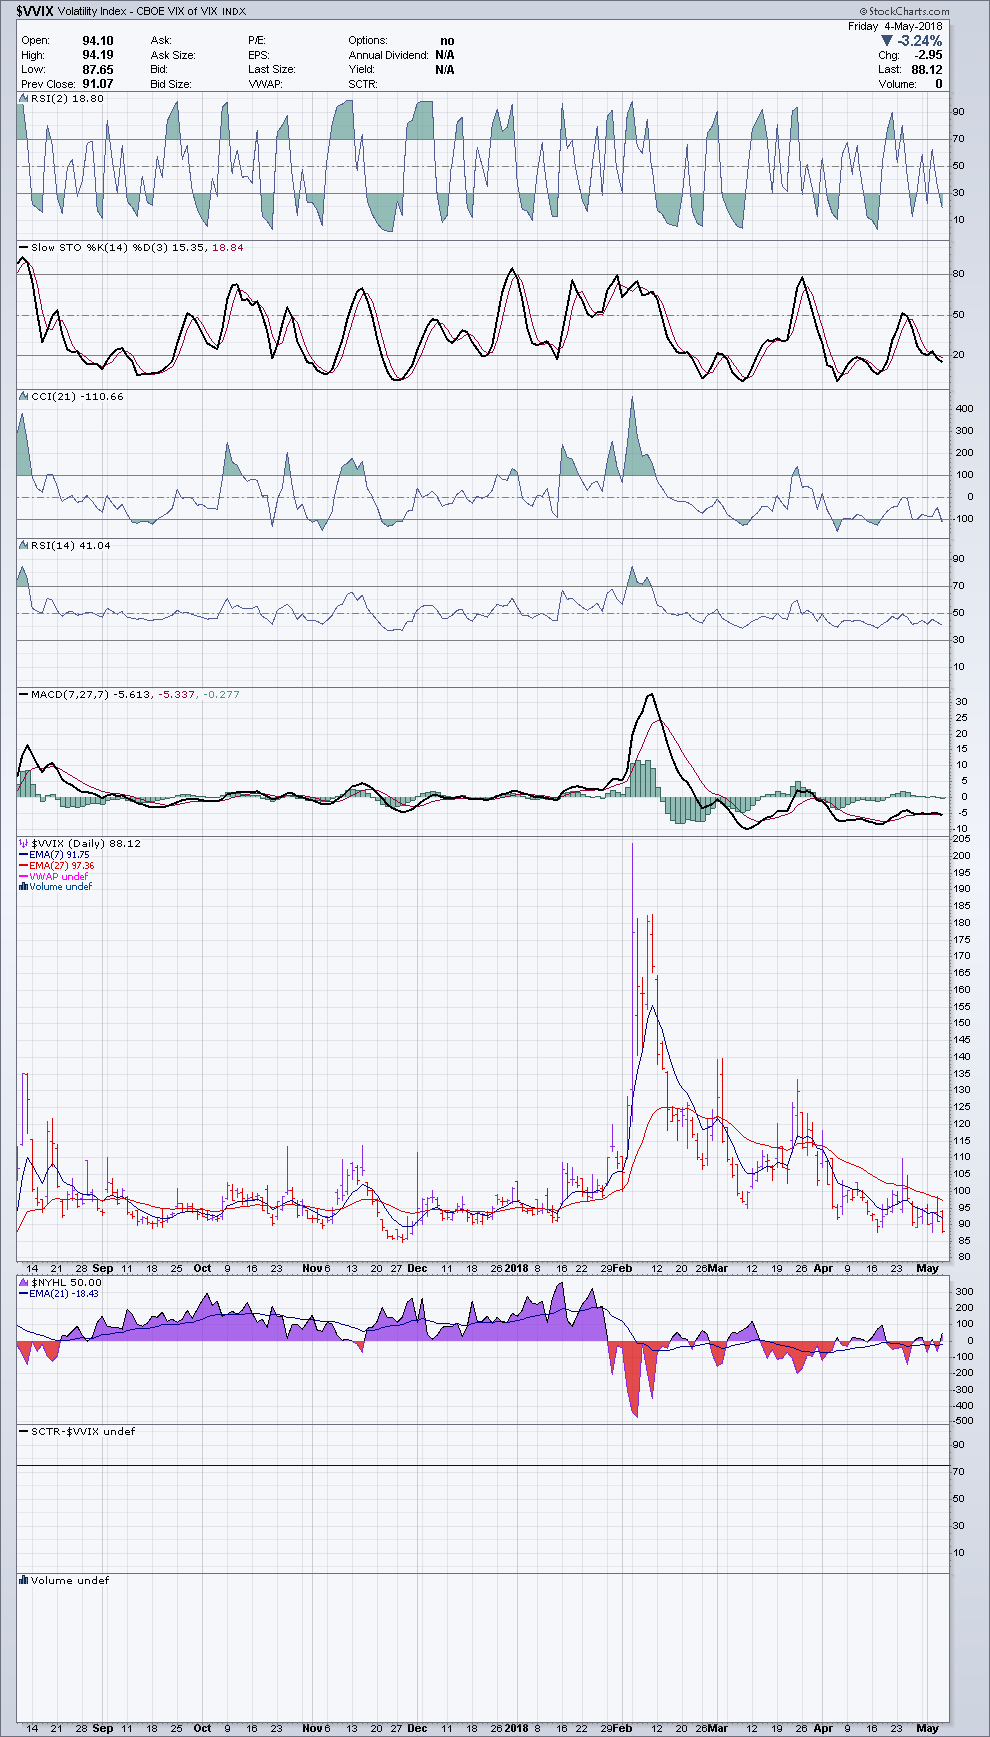
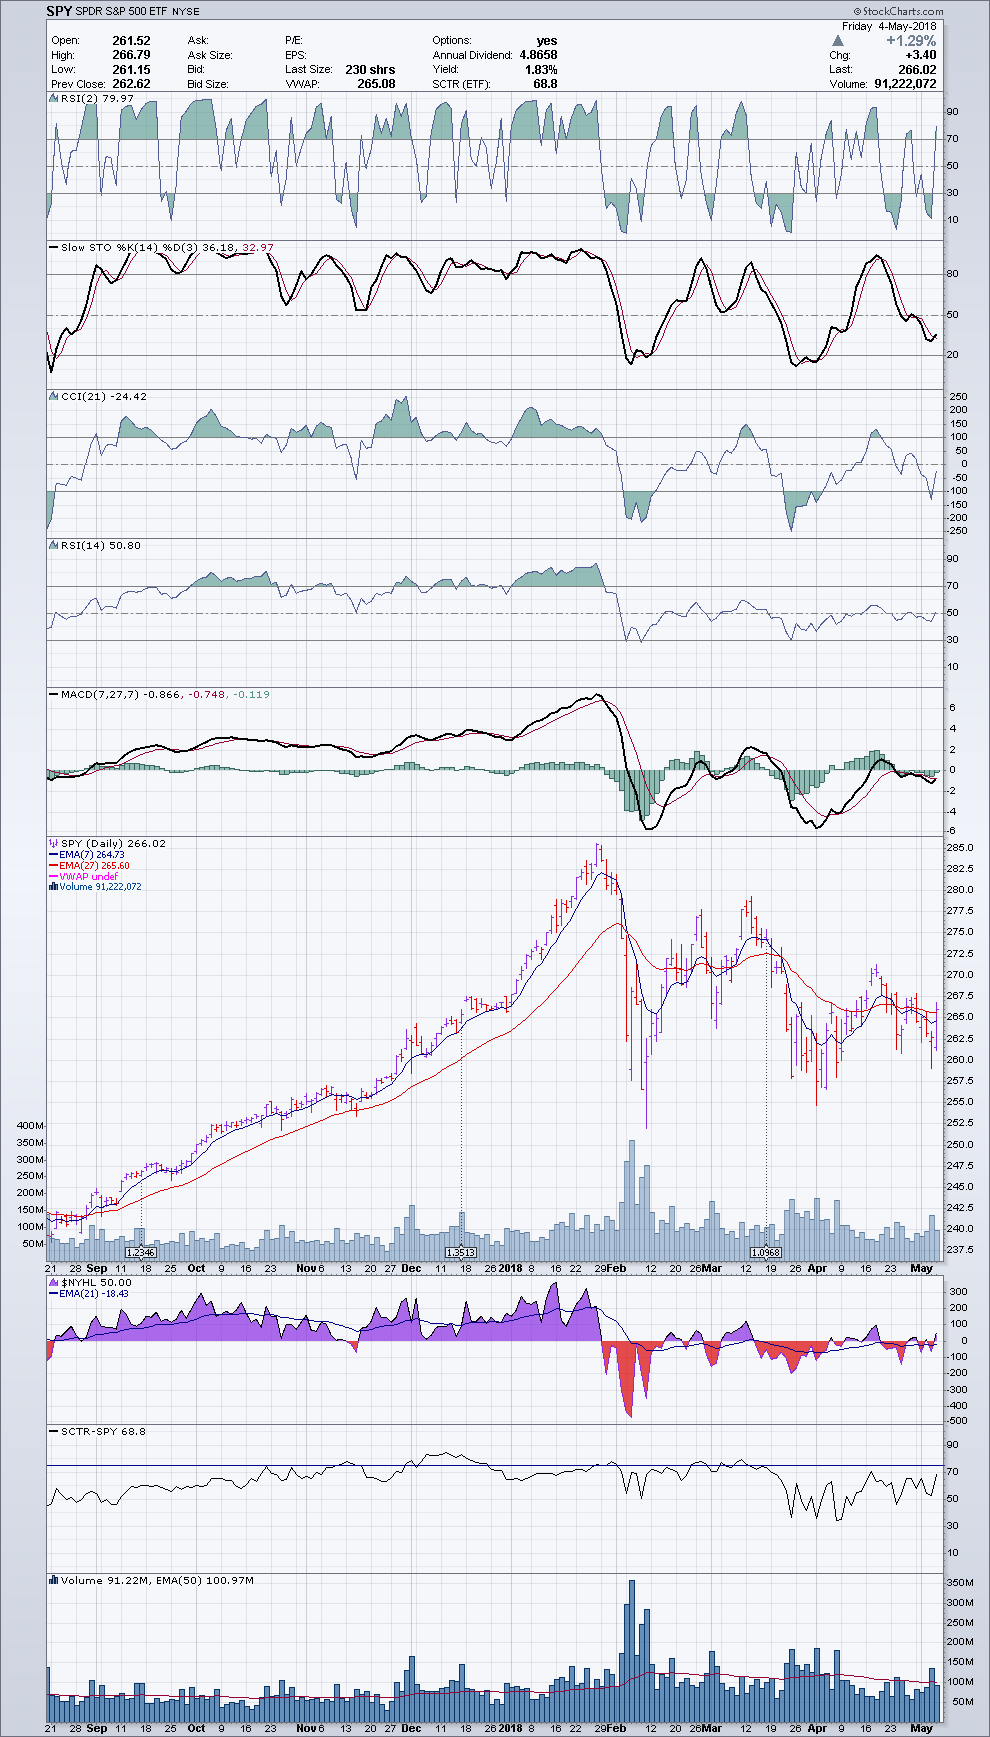
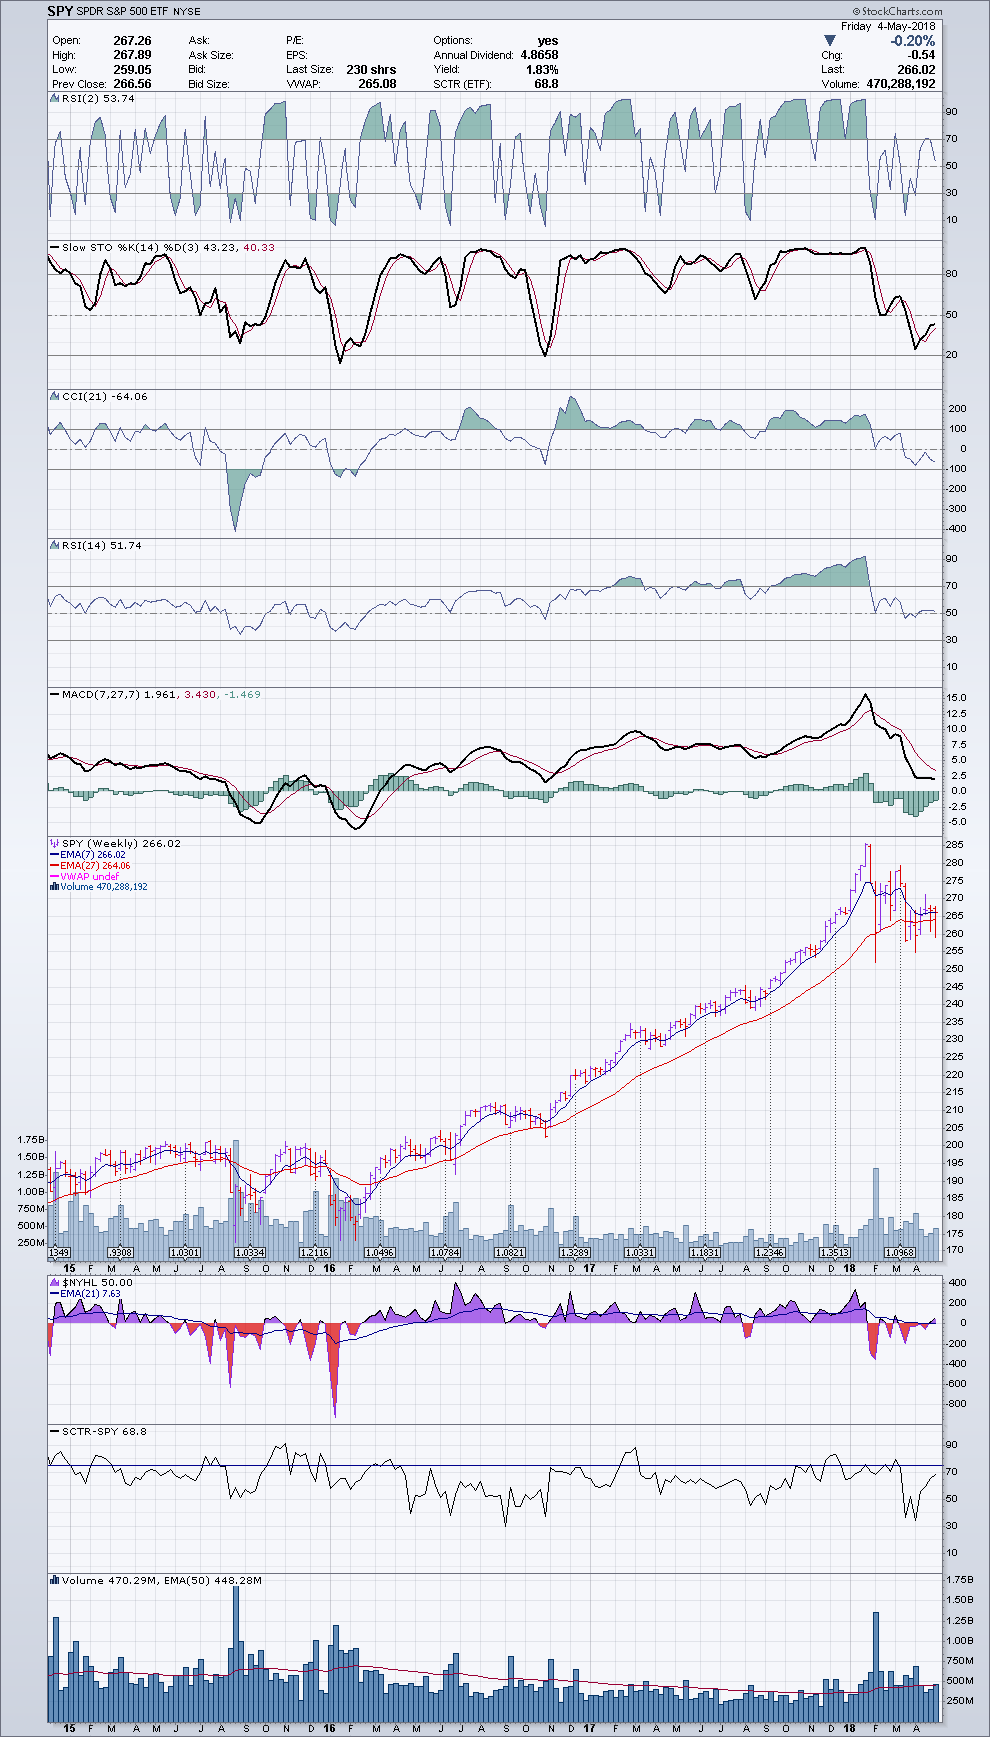
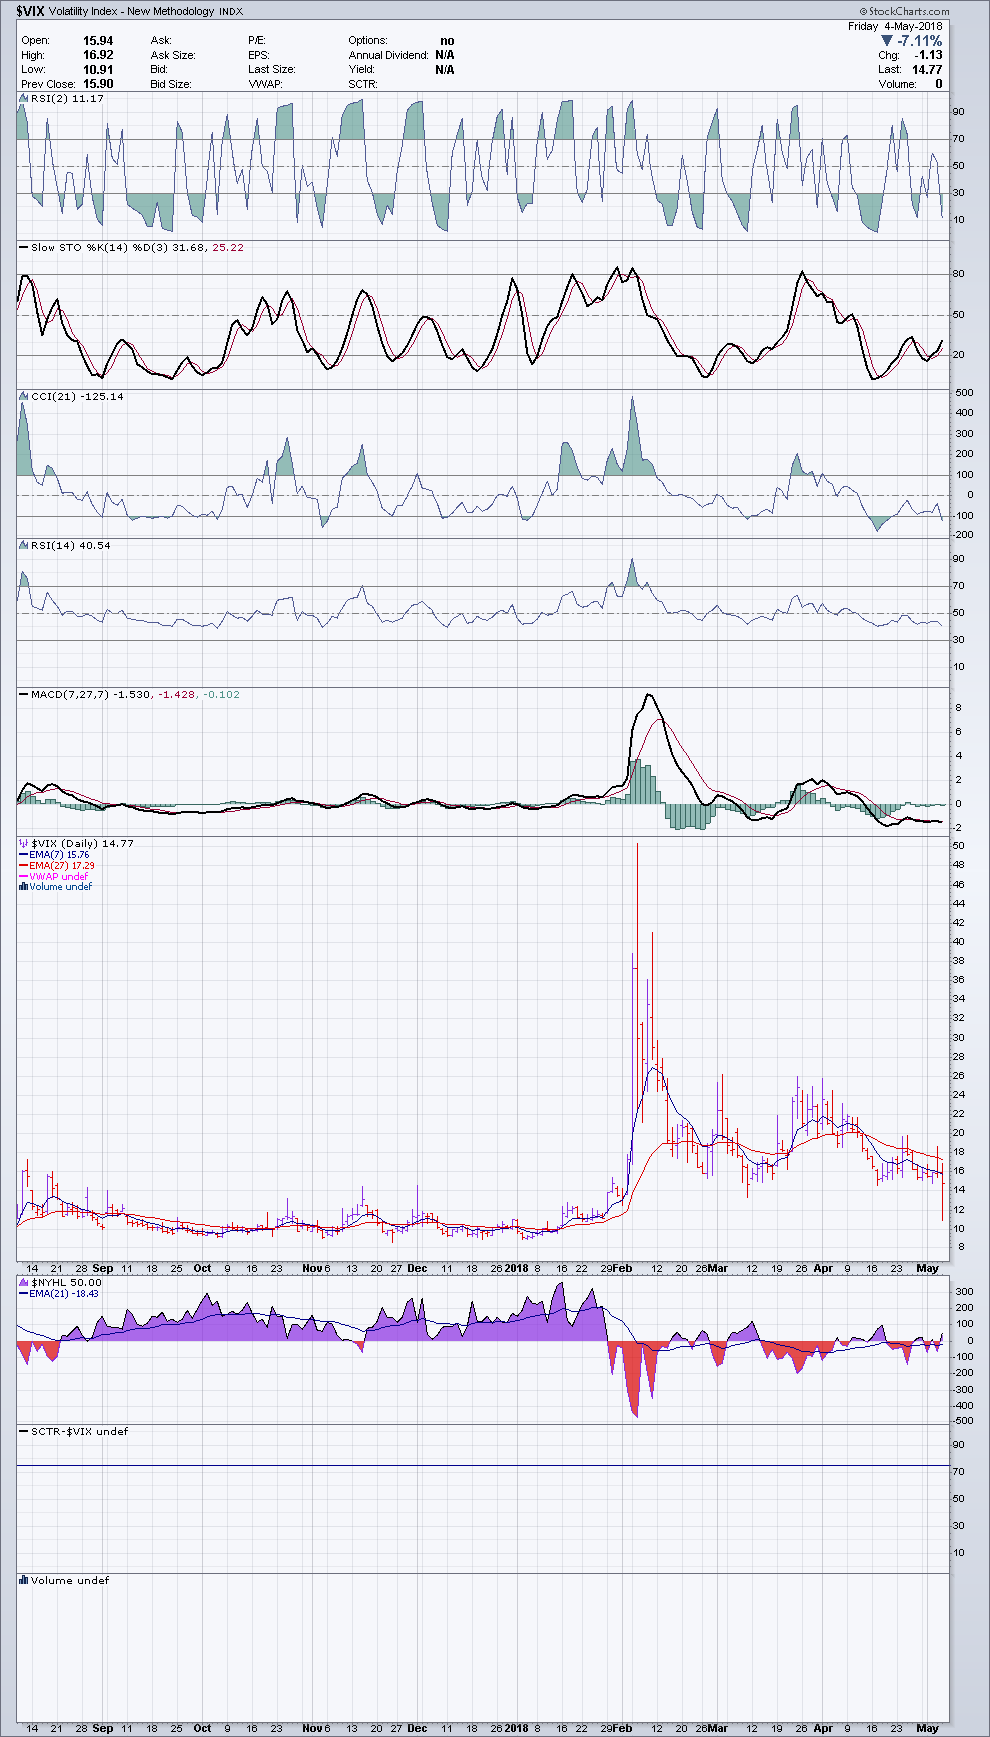
The SPY sailed the eighteenth week of 2018 with tail winds. The VIX is now comfortably at 14% (when VIX goes down the SPY goes-up and vice versa – see chart n. 3). The volatility of VIX (VVIX – chart 4) show the fluctuations of VIX are at the same level than during the bull market of 2017: a positive sign. The long-term chart is showing a feeble bullishness (see chart 2 - SPY - weekly). SPY attained a new historical high at 286.63 points on January 26, 2018. Presently it is at the same price as December 28, at 266.02 points.
It is possible that the political surprises amplified by the media (about the tariff and the rest) is finished and the return to normality is approaching. The U.S. has a population of 326 million and their economy is more on internal consumption than exportation, at the opposite of countries like Germany, where the exportations are more important than the internal consumption. Even if Walmart prices will increase, people will adapt with relative discontent.
The conclusion about this past week: the hurricane is gone and clouds are less dark. The blue sky is closer.
The Langford Management
Presently our investments are in ETFs and ETN offering a high return, with a dividend yield between 5 to 10 % per year, at pro rata temporis, monthly. The market has still a strong positive bias. We don’t think for the moment to change the allocation because also the products with higher returns are also bullish.
In the USD accounts, still we have cash, in the form of FLOT, MINT, NEAR. In the CAD accounts, it is PSA or the equivalents. In the average, our portfolios are invested 60% in revenue and 40% in directivity.
In some, more aggressive accounts we have increased the capital synthetically with option strategies to profit of the actual upward strong momentum. In accounts that allow futures markets, we have futures contracts in long position on stock indexes.
Our portfolio management is always ad hoc, for each client. But also, we offer now five standardized mini-portfolios for clients interested:
Bullish aggressive
A contrarian as a hedge or profit
Bullish and dividend oriented
Against inflation
Bullish, aggressive on non-traditional assets.
(The portfolio management fees of Charles K. Langford Inc. is 0.9% of assets, per year (equivalent to $900 per $100,000). The capital under management is invested exclusively in ETF, ETN and options)
Among a group of selected stocks and ETFs, the week just ended has given middle- and long-term buy signals for the following stocks and ETFs.
TREND FOLLOWING
|
Middle-term bullish |
Long-term bullish |
|
|
Canadian Market |
AZ.TO |
ASR.TO |
Options Strategies
Investors that believe the current Canadian market offers interesting bullish opportunities, they can buy the call on BMO (it closed Friday at $98.05) July 20/92.00 @ $7.15 whose delta is 0.89 and gamma 0.04(accelerator of delta). This call will offer a profit of 89% of the stock increase at a cost that is about 14 times lower than the present price. If the stock goes down, the maximum loss is the premium.
SPY - Daily - 2018/05/04
SPY - Weekly - 2018/05/04
VIX - Daily - 2018/05/04
VVIX - Daily - 2018/05/04