Financial Letter - November 18th, 2018
198th Issue (since 01/24/2015)
Since the middle of October we started the publication of a “Daily Bulletin” with buy, sell, hold signals, based on short-, intermediate-, long-term, on five securities. All subscribers to our Financial Letter will receive this daily DB. We hope this will be useful.
The book “L’alchimie qui crée l’or – Le chasseur de tendances boursières II” is now online (Amazon.ca and the title) on Kindle. It is in French. The book is now a “bestseller” in the category business and finance. It's also available on all other readers platforms (Kobo, iBook, etc.).
A second book is now available on the reading software like Kindle, Kobo, iBook, etc. Its title is “The Trend Hunter” and it is in English.
The mean of return of portfolios managed by Charles K. Langford Inc. in 2016 has been 10.90% and standard deviation of 3.75, after trading commissions and ¾ of management fees.
The mean of return of portfolios managed by Charles K. Langford Inc. in 2017 has been 13.50% with a standard deviation of 4.65%, after trading commissions and ¾ of management fees. The large standard deviation is explained by options strategies that have given a higher return.
Market Risk (Systematic Risk)
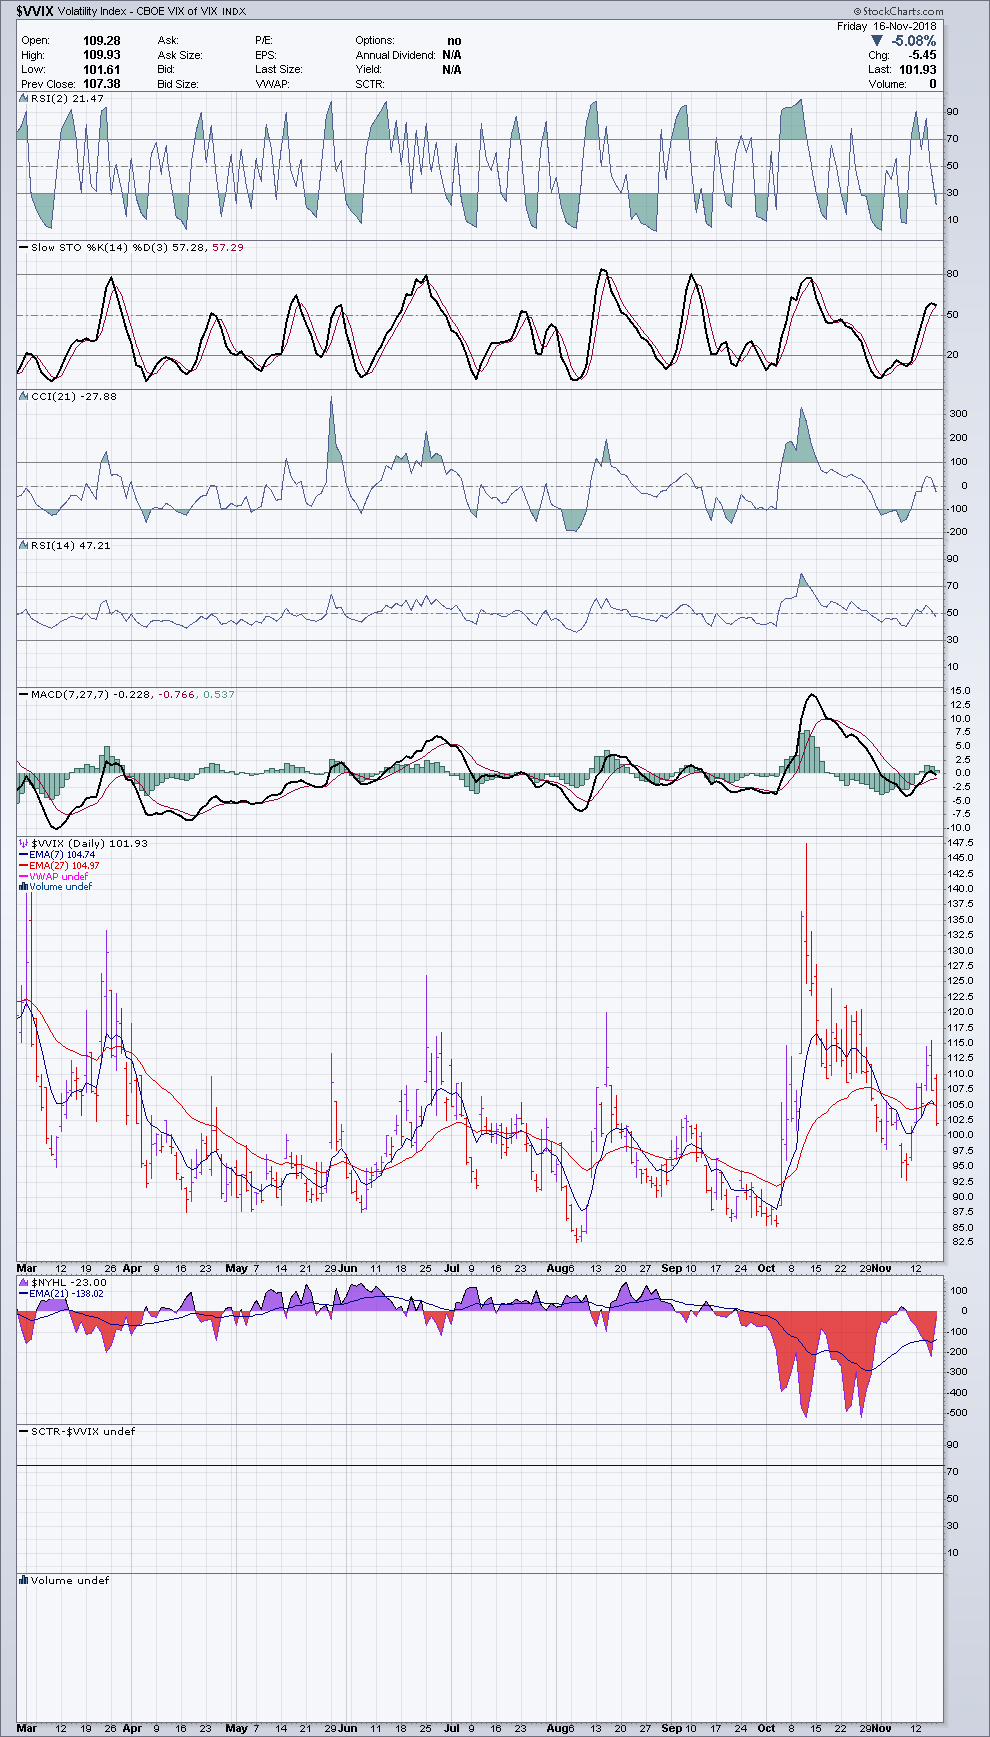
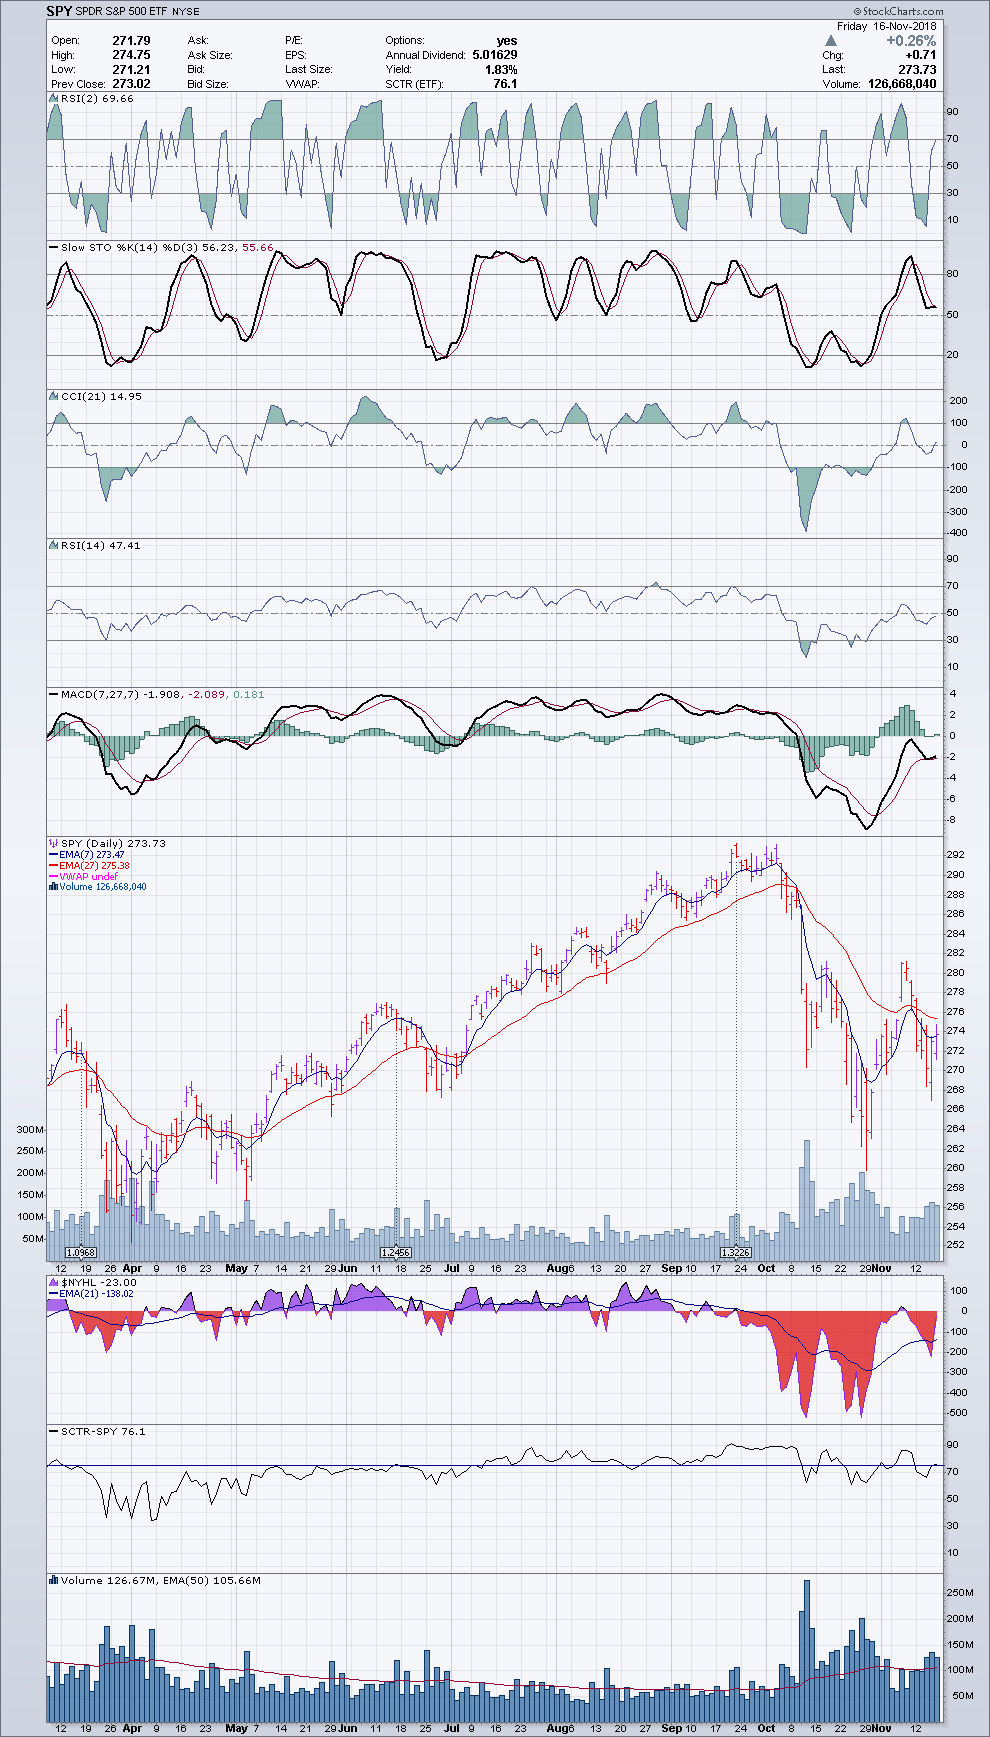
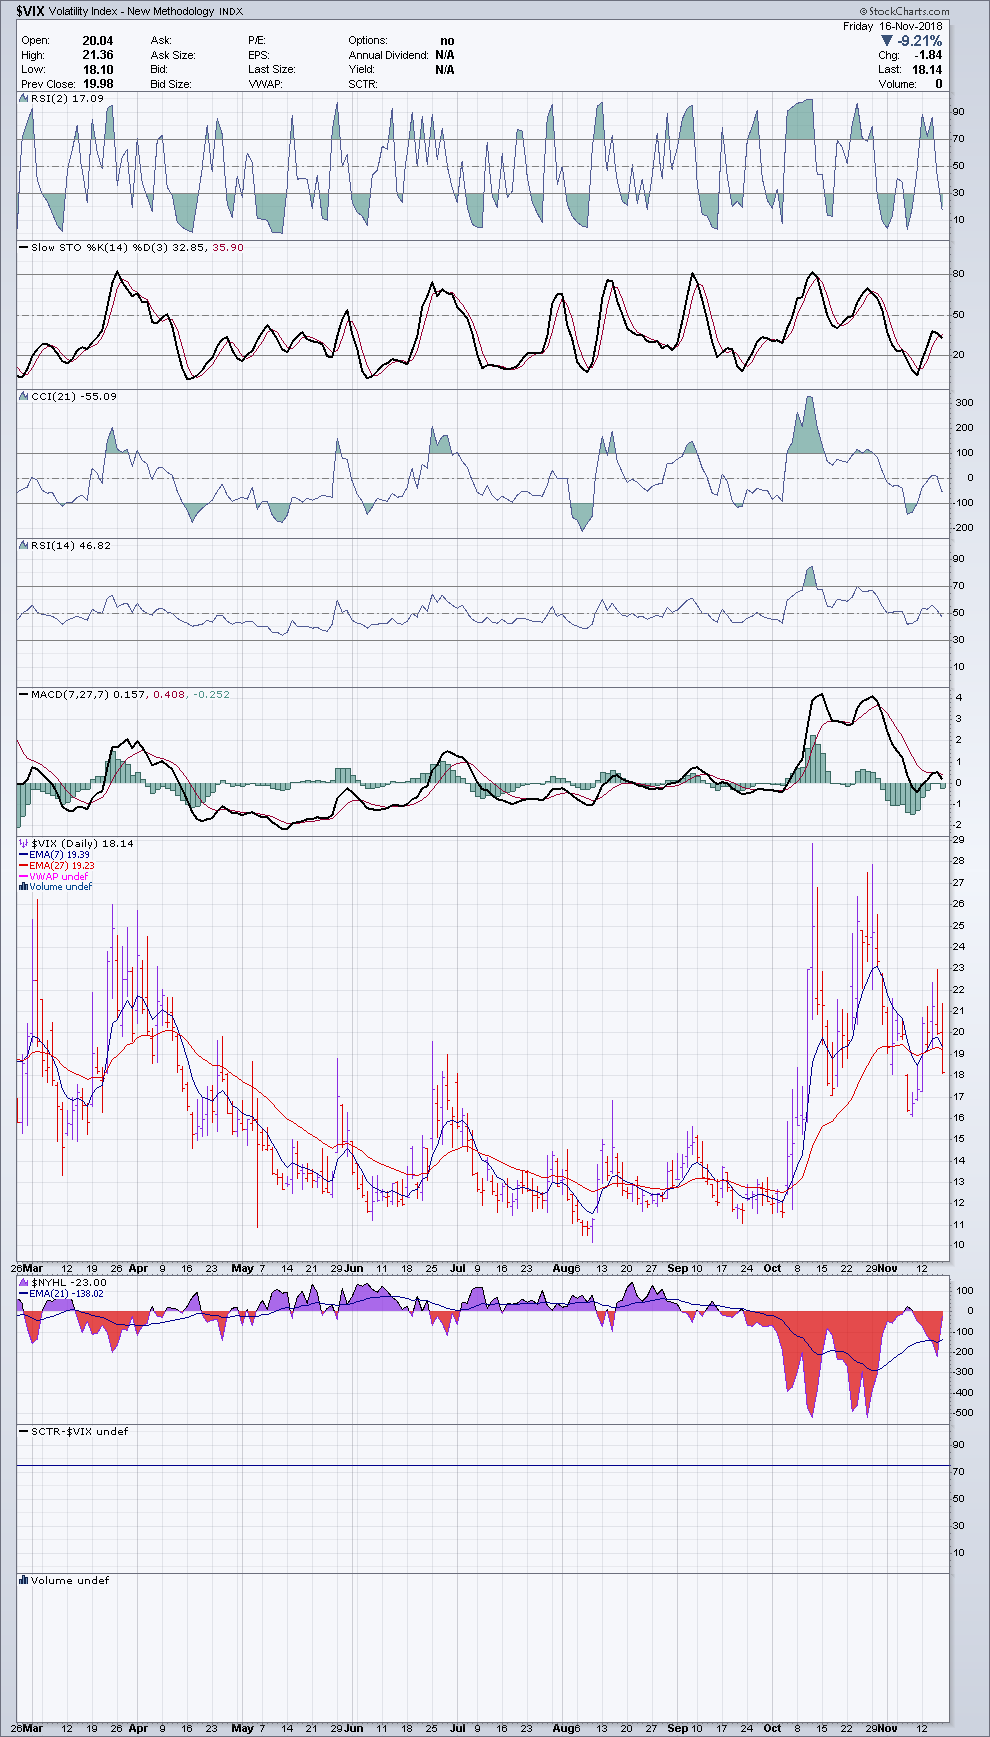
The SPY sailed the forty-sixth week of 2018 with sustained tailwinds and headwinds that ended the week with a loss of four points. The good news it covered all the recent downside large gaps. VIX is at 17.50%: it is still uncomfortable but it shows a trend towards more positive levels, as the VVIX also indicates a lower volatility of VIX. We believe the market is still too erratic and it better do nothing and wait until the VIX will be lower.
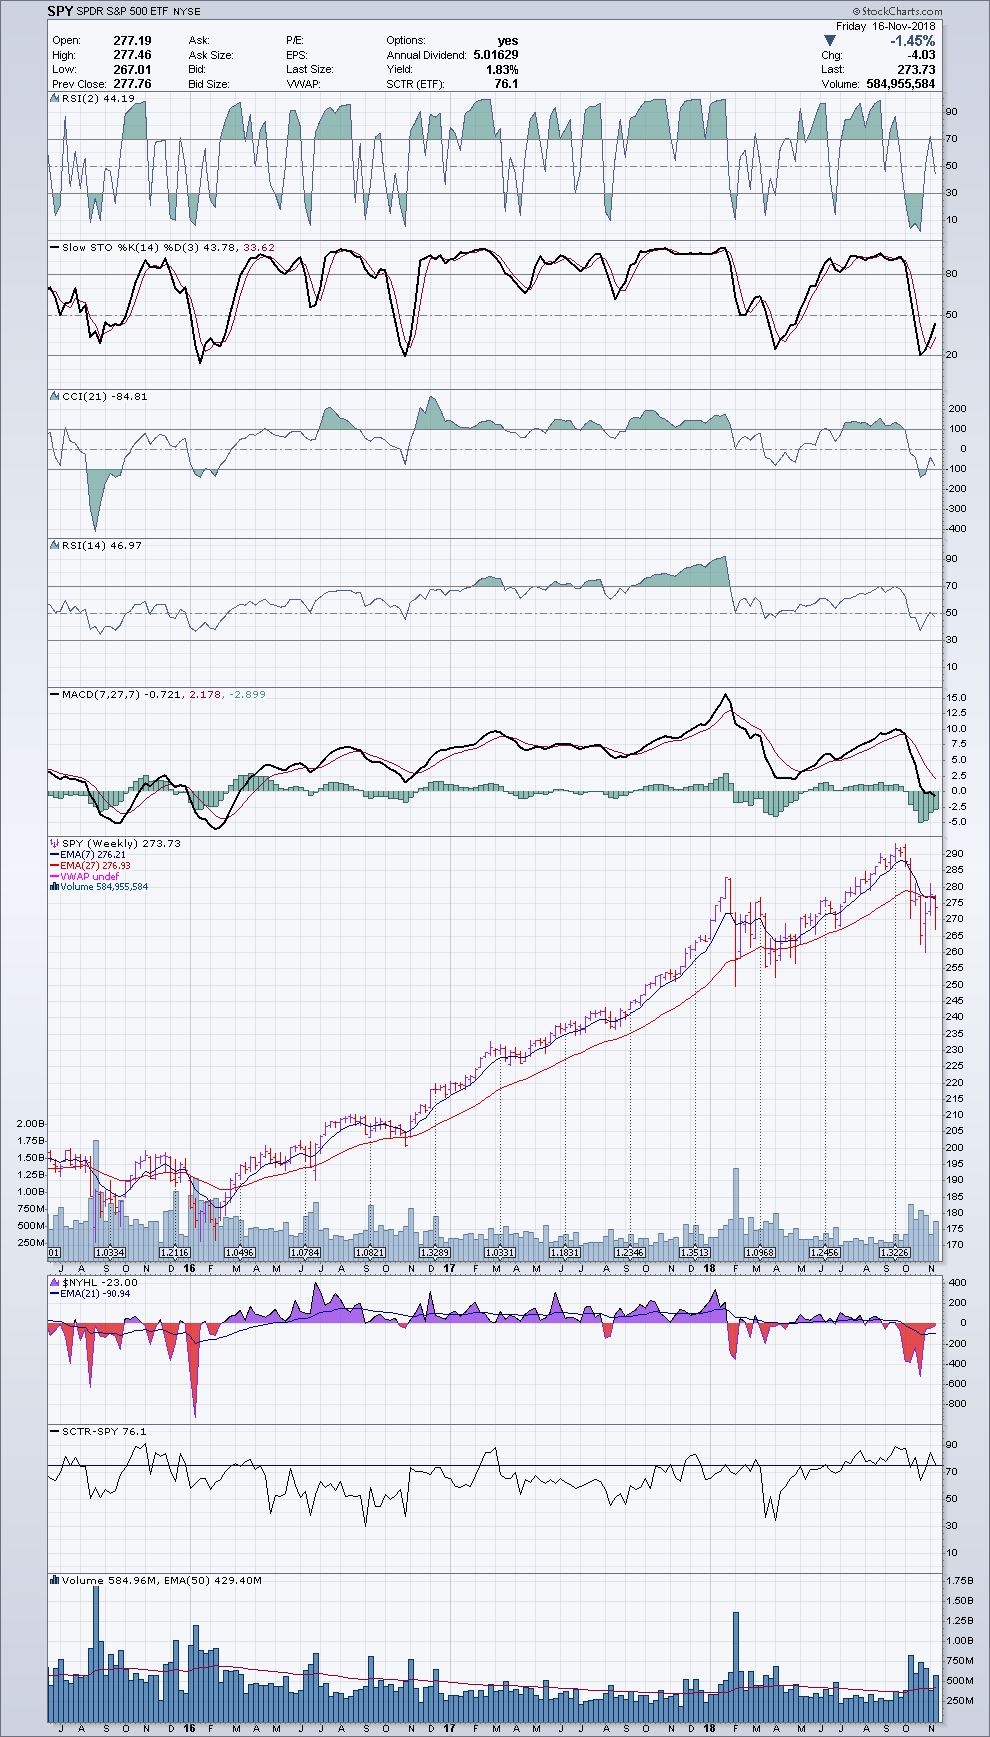
The long-term chart (chart 2 - SPY - weekly) indicates the bull trend is on hold, because the EMA7,27 crossed this week again on the downside in a whipsaw market.
A private indicator (CKL21) shows the market is optimistic towards the upside.
The Langford Management
Presently our investments are in ETFs and ETN offering a high return, with a dividend yield between 5 to 10 % per year, at pro rata temporis, monthly. The market has still a strong positive bias. We don’t think for the moment to change the allocation because also the products with higher returns are also bullish.
In the USD accounts, still we have cash, in the form of FLOT, MINT, NEAR. In the CAD accounts, it is PSA or the equivalents. In the average, our portfolios are invested 60% in revenue and 40% in directivity.
In some, more aggressive accounts we have increased the capital synthetically with option strategies to profit of the actual upward strong momentum. In accounts that allow futures markets, we have futures contracts in long position on stock indexes.
Our portfolio management is always ad hoc, for each client. But also, we offer now five standardized mini-portfolios for clients interested:
- Bullish aggressive
- A contrarian as a hedge or profit
- Bullish and dividend oriented
- Against inflation
- Bullish, aggressive on non-traditional assets.
(The portfolio management fees of Charles K. Langford Inc. is 0.9% of assets, per year (equivalent to $900 per $100,000). The capital under management is invested exclusively in ETF, ETN and options)
Among a group of selected stocks and ETFs, the week just ended has given middle- and long-term buy signals for the following stocks and ETFs.
TREND FOLLOWING
|
Middle-term bullish |
Long-term bullish |
|
|
Canadian Market |
DCOP.V |
GRAT.V |
About Options
Investors that believe the current Canadian market offers interesting bullish opportunities, they can buy the call SAP (stock closed Friday at $39.29) January 18/36.00 @ $4.15 whose delta is 0.76 and gamma 0.06 (accelerator of delta). This call will offer a profit of 76% of the stock increase at a cost that is about 9 times lower than the present price. If the stock goes down, the maximum loss is the premium.
SPY - Daily - 2018/11/16
SPY - Weekly - 2018/11/16
VIX - Daily - 2018/ 11/16
VVIX - Daily - 2018/11/16