Financial Letter - September 2nd, 2018
187th Issue (since 01/24/2015)
Market Risk
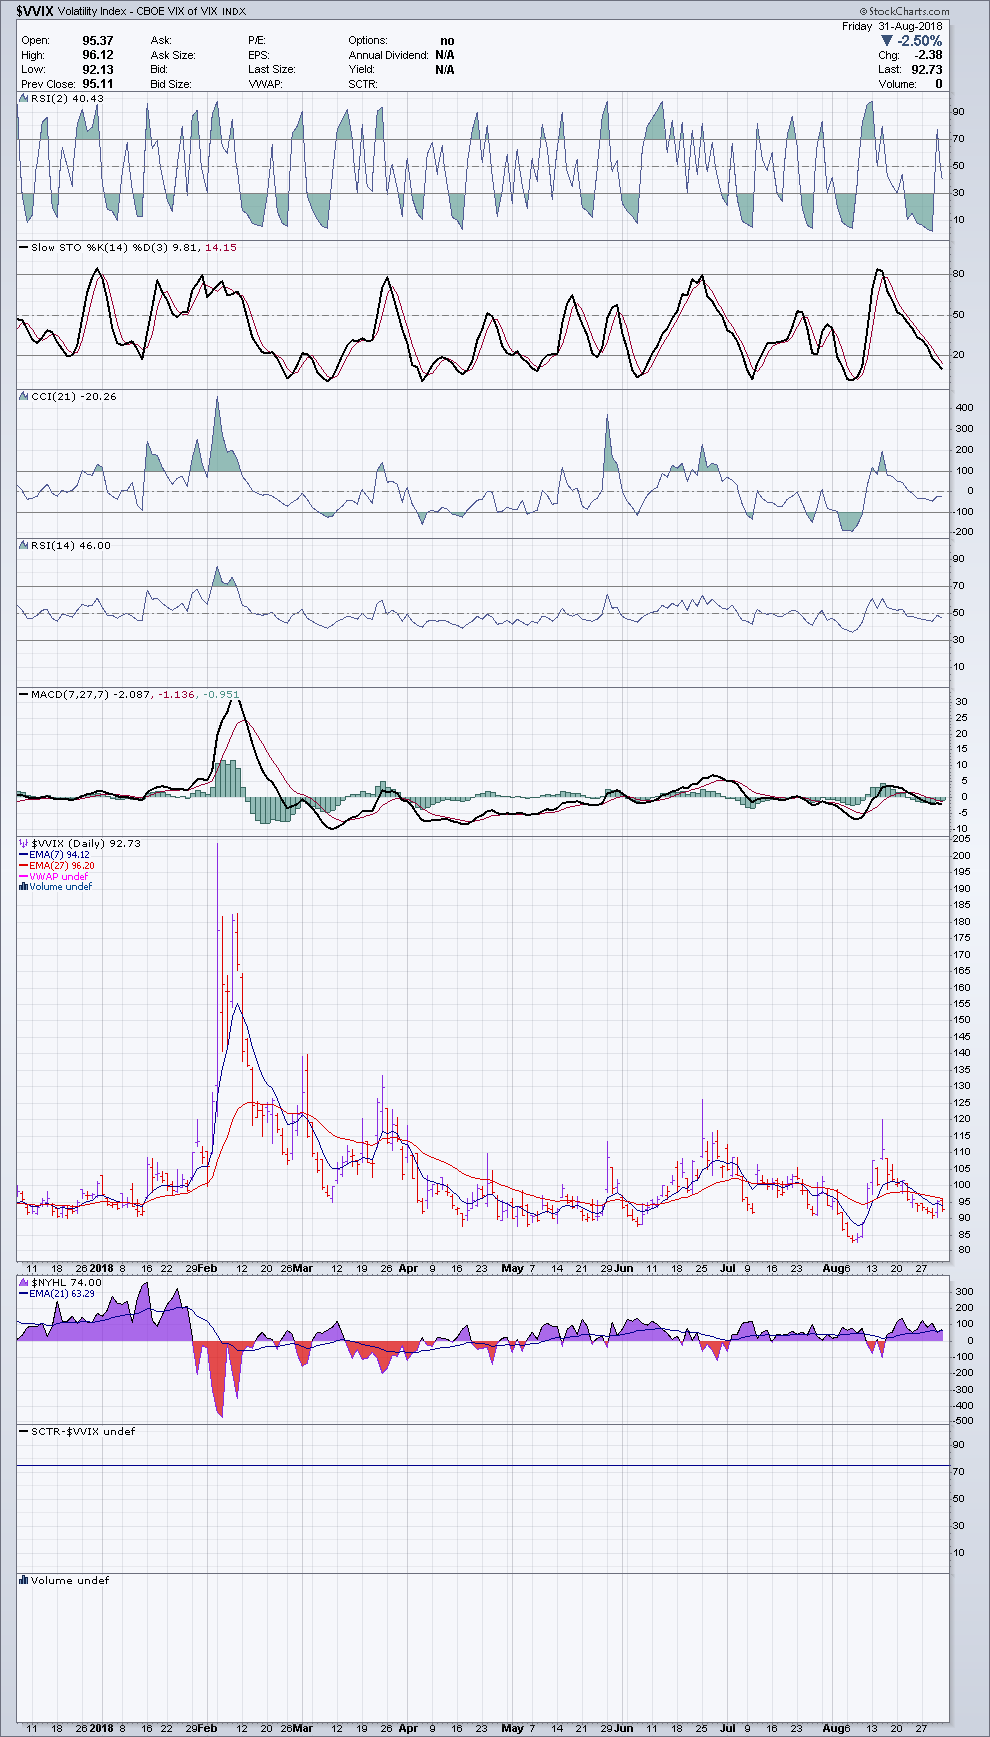
The SPY sailed the thirty-seventh week of 2018 with tailwinds that made the SPY reaching another new historical high and terminating with a good probability the 6-month congestion started February 2. The VIX is low and the EMA crossed on the downside: a positive sign (when VIX goes down the SPY goes-up and vice versa – see chart n. 3). The volatility of VIX (VVIX – chart 4) shows the fluctuations of VIX are slowing. The long-term chart is showing a comfortable bullishness (see chart 2 - SPY - weekly).
The conclusion about this past week: technically speaking, the market is still in a somewhat negative bias with a propensity towards more optimism.
The Langford Management
Presently our investments are in ETFs and ETN offering a high return, with a dividend yield between 5 to 10 % per year, at pro rata temporis, monthly. The market has still a strong positive bias. We don’t think for the moment to change the allocation because also the products with higher returns are also bullish.
In the USD accounts, still we have cash, in the form of FLOT, MINT, NEAR. In the CAD accounts, it is PSA or the equivalents. In the average, our portfolios are invested 60% in revenue and 40% in directivity.
In some, more aggressive accounts we have increased the capital synthetically with option strategies to profit of the actual upward strong momentum. In accounts that allow futures markets, we have futures contracts in long position on stock indexes.
Our portfolio management is always ad hoc, for each client. But also, we offer now five standardized mini-portfolios for clients interested:
Bullish aggressive
A contrarian as a hedge or profit
Bullish and dividend oriented
Against inflation
Bullish, aggressive on non-traditional assets.
(The portfolio management fees of Charles K. Langford Inc. is 0.9% of assets, per year (equivalent to $900 per $100,000). The capital under management is invested exclusively in ETF, ETN and options)
Among a group of selected stocks and ETFs, the week just ended has given middle- and long-term buy signals for the following stocks and ETFs.
TREND FOLLOWING
|
Middle-term bullish |
Long-term bullish |
|
|
Canadian Market |
GOOD.V |
ENER.V |
Options Strategies
(due to Labor Day Holiday, Options at the TSX (Montréal) were not accessible. What follows is the previous week text.
Investors that believe the current Canadian market offers interesting bullish opportunities, they can buy the call on AC (it closed Friday at $26.82) October19/20.00 @ $7.25 whose delta is 0.99 and gamma 0.01 (accelerator of delta). This call will offer a profit of 99% of the stock increase at a cost that is about 4 times lower than the present price. If the stock goes down, the maximum loss is the premium.
SPY - Daily - 2018/08/31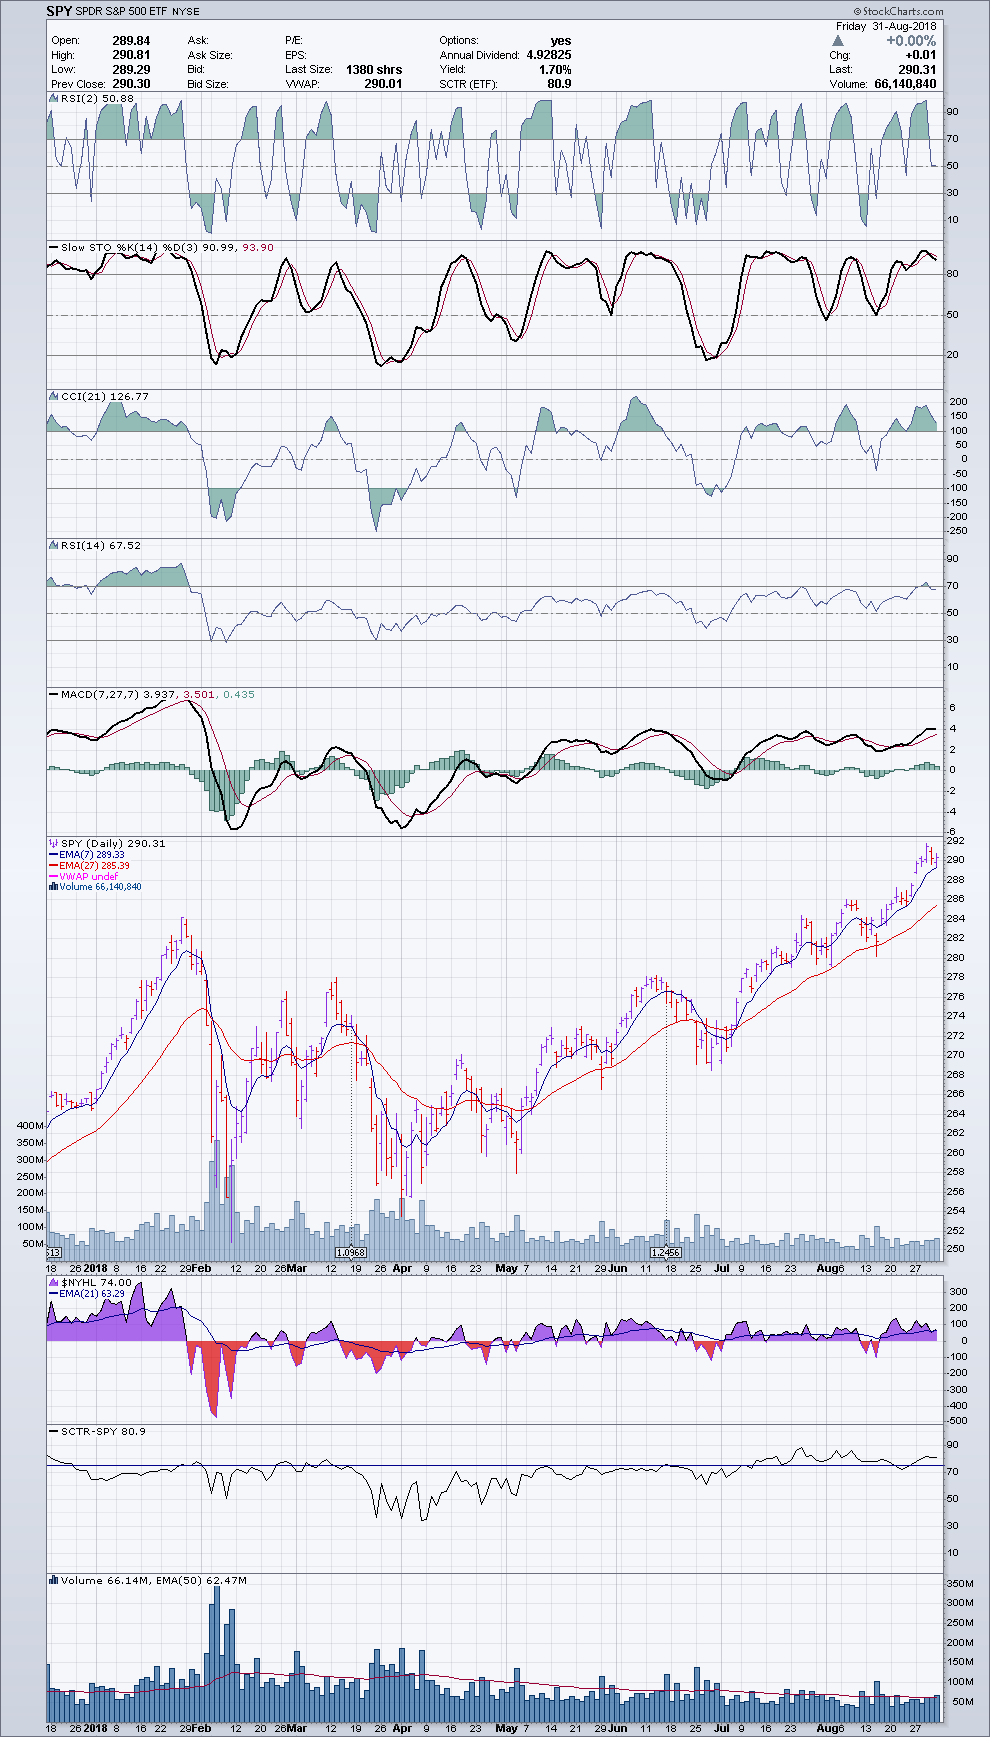
SPY - Weekly - 2018/08/31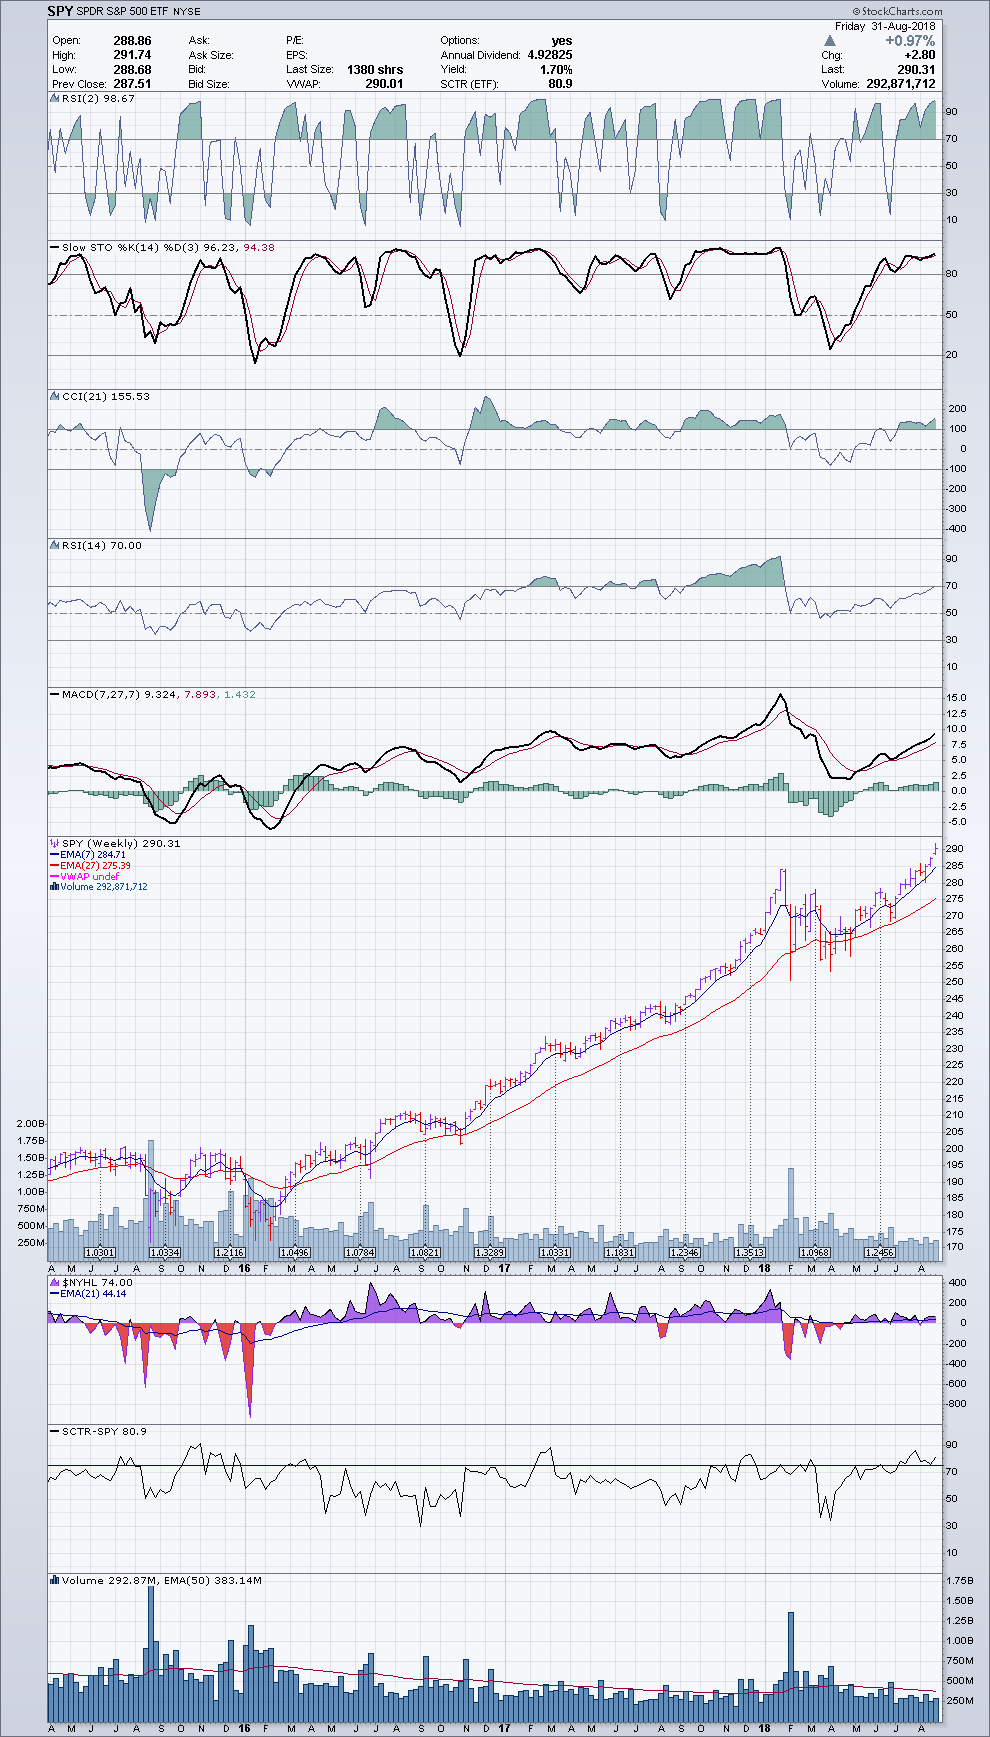
VIX - Daily - 2018 /08/31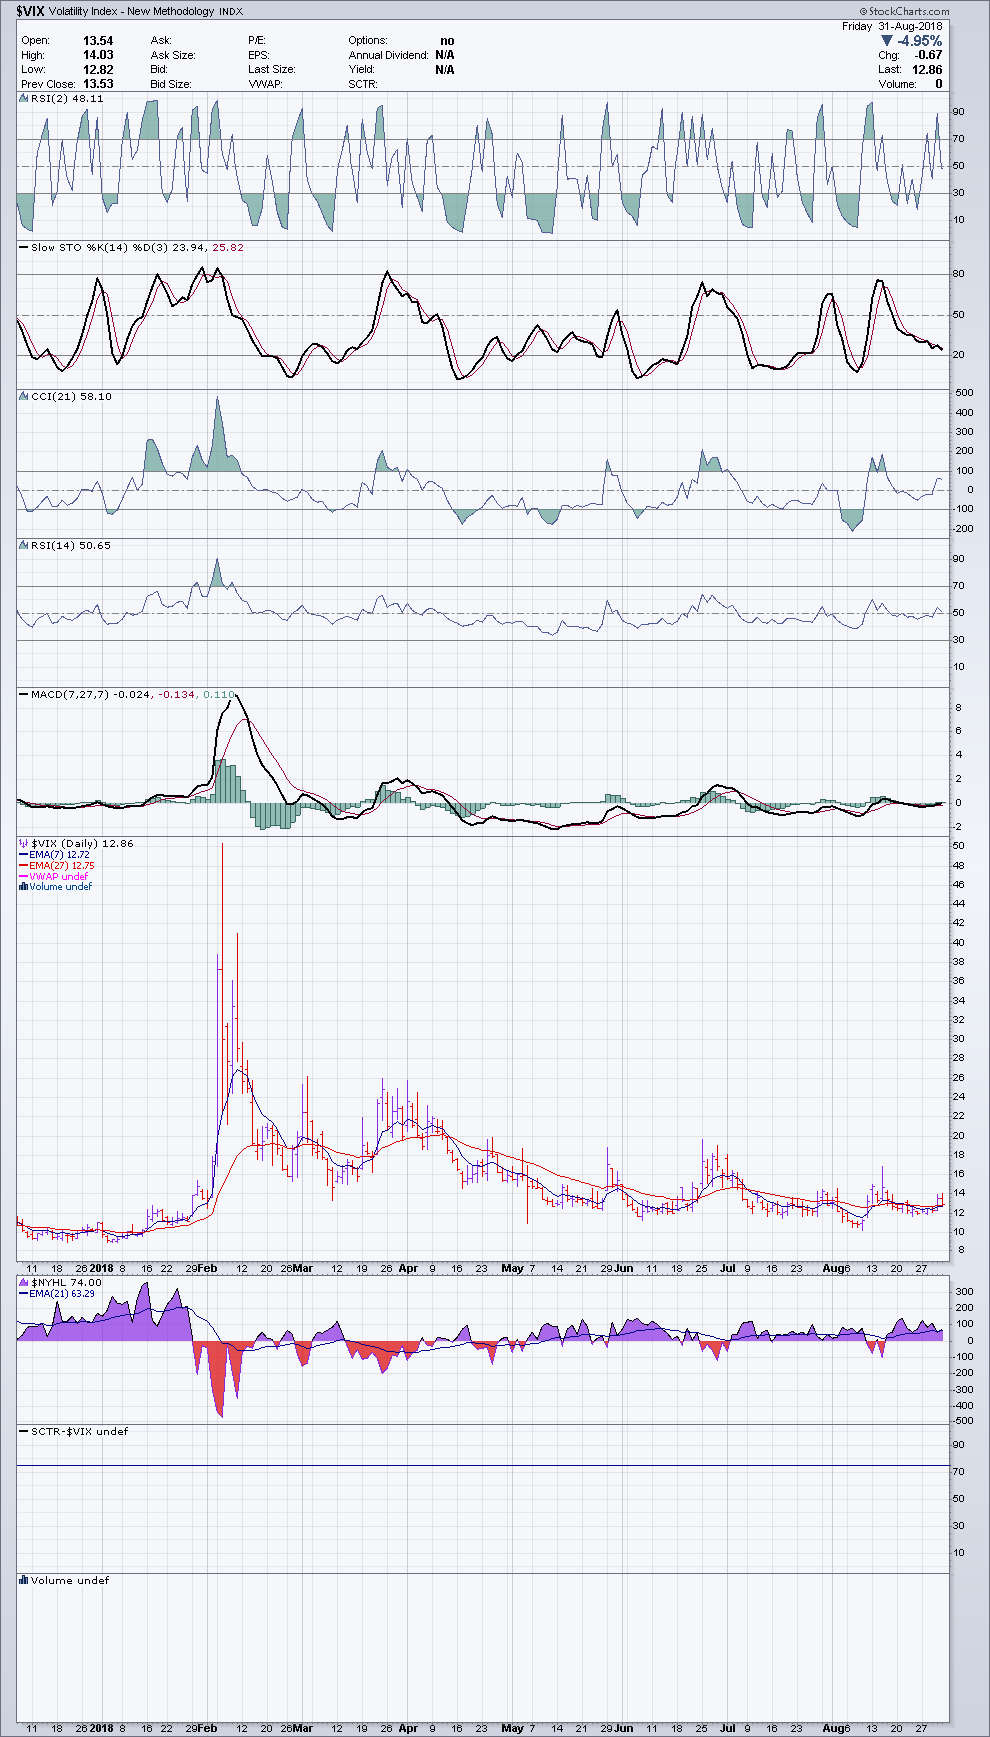
VVIX - Daily - 2018/08/31